
What changes as a chicken caecal community matures: the union of capabilities its members encode, or the repertoire carried by each member? We followed 822 bacterial metagenome-assembled genomes (MAGs) across 388 samples at days 7, 21 and 35. The two views tell different stories.
The main analysis below uses the original Drakkar annotation and database 2026.30.1. A later section evaluates the same MAGs with giftag and compares both annotations on database 2026.39.1. The two releases are kept separate.
The source study used distillR to score 170 quantitative GIFTs and reported a decline in mean community-weighted metabolic capacity with chicken age. Here the same archive is reannotated and read as complete, traceable gifter capabilities. These are different definitions and summaries, so the original score is context for the question rather than a directly comparable gifter metric.
In short
- Median community metabolic richness was 111, 110 and 111 GIFTs at the three ages.
- Median mean metabolic repertoire per detected MAG fell from 38.26 to 29.08 GIFTs.
- Three of the 19 curated reference frames had a decrease beyond one GIFT in per-MAG richness at both later ages. Their community unions remained within that margin.
- An apparent two-band pattern in community richness follows the operational detection of one broad-repertoire Escherichia coli MAG.
These are encoded capabilities. They say nothing directly about expression, flux, nutrient exchange, growth or host phenotype. If a GIFT call is new to you, start with a single genome.
The dataset and its boundary
We used the public archive of the Marcos et al. chicken caecal study. The archive’s abundance matrix has 825 rows. An exact join to its published bacterial taxonomy retained 822 MAGs. Their assemblies were checksum-verified and reannotated with Drakkar’s gene-resolved marker projection, producing 11,219,684 marker rows. gifter evaluated those markers into 23,220 supported MAG–GIFT pairs, across 133 of the 156 catalogue GIFTs. This reading uses database version 2026.30.1.
library(gifter)

# Gene-resolved marker rows have genome_id, gene_id, namespace and accession.
catalogue <- evaluate_gifts_community(markers)
dataset <- gifter_dataset(catalogue, abundance, metadata)
The archived data lack the per-sample genome-breadth matrix used in the source paper. We therefore call a MAG detected when its reconstructed relative abundance is greater than 0.001 for the primary reading, and repeat the analysis at greater than 0, 0.00001 and 0.0001. This threshold is an operational choice; it does not reproduce the source paper’s breadth filter. A completeness estimate below 90% makes an unsupported call indeterminate for absence denominators only. Detection and completeness never promote a GIFT call to supported.
A broad union, narrower members
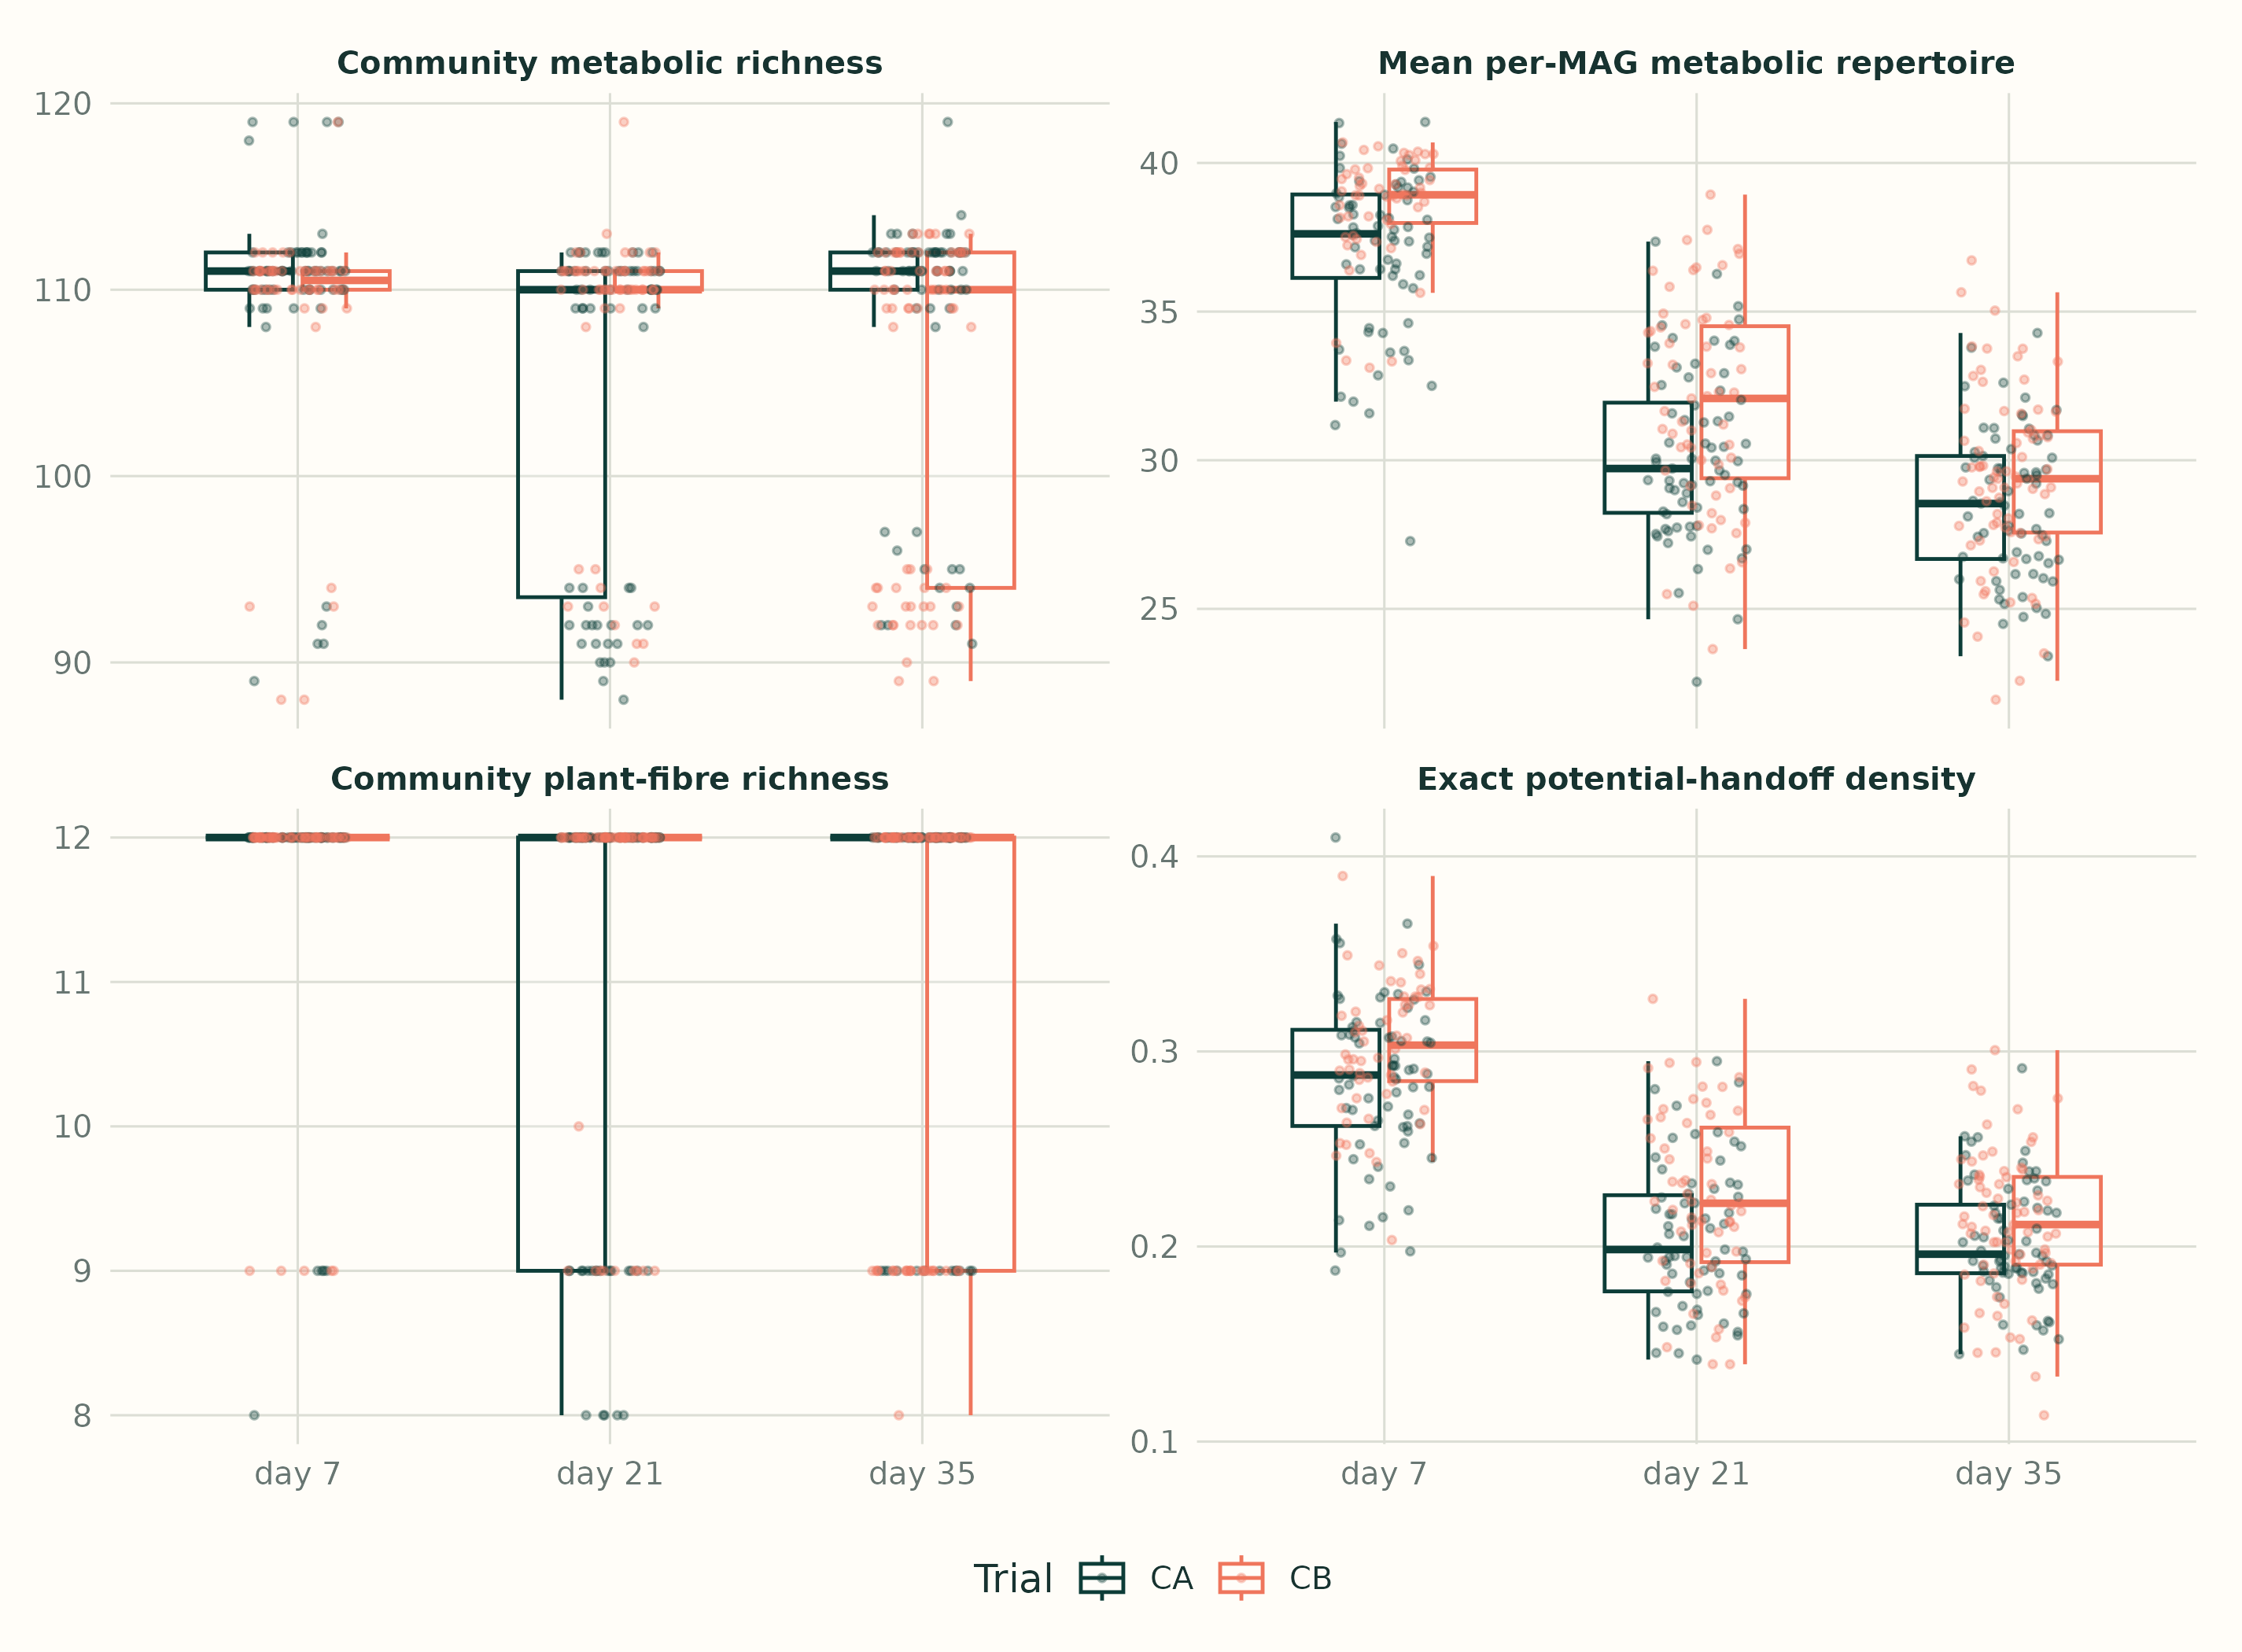
Sample-level results at relative abundance > 0.001. Boxes show distributions within each age and trial; points are samples. Density counts compatible ordered MAG pairs over eligible ordered pairs for the exact plant-fibre network. It is potential topology, not observed exchange.
Median detected MAG count rose from 133.5 at day 7 to 162 at day 35. Community metabolic richness remained near 110, while mean per-MAG metabolic richness fell. In models adjusting for trial, treatment, breed and sex, with a random intercept for pen, the day-21 and day-35 differences in mean per-MAG richness from day 7 were -6.77 and -8.83 GIFTs. Those directions persisted at every tested detection threshold. The community’s bounded biomass-essential coverage stayed at a median of 86.4% at all three ages. A broad community union can therefore coexist with a narrower encoded repertoire in each detected member.
What the curated frames add
Each reference frame is a database-defined set of GIFTs. The analysis compared all 19 frames. A change was called stable within margin only when both later-age contrasts were equivalent within one GIFT for counts, or five percentage points for bounded coverage, at all four detection thresholds. A nonsignificant age test by itself was not treated as evidence of stability.
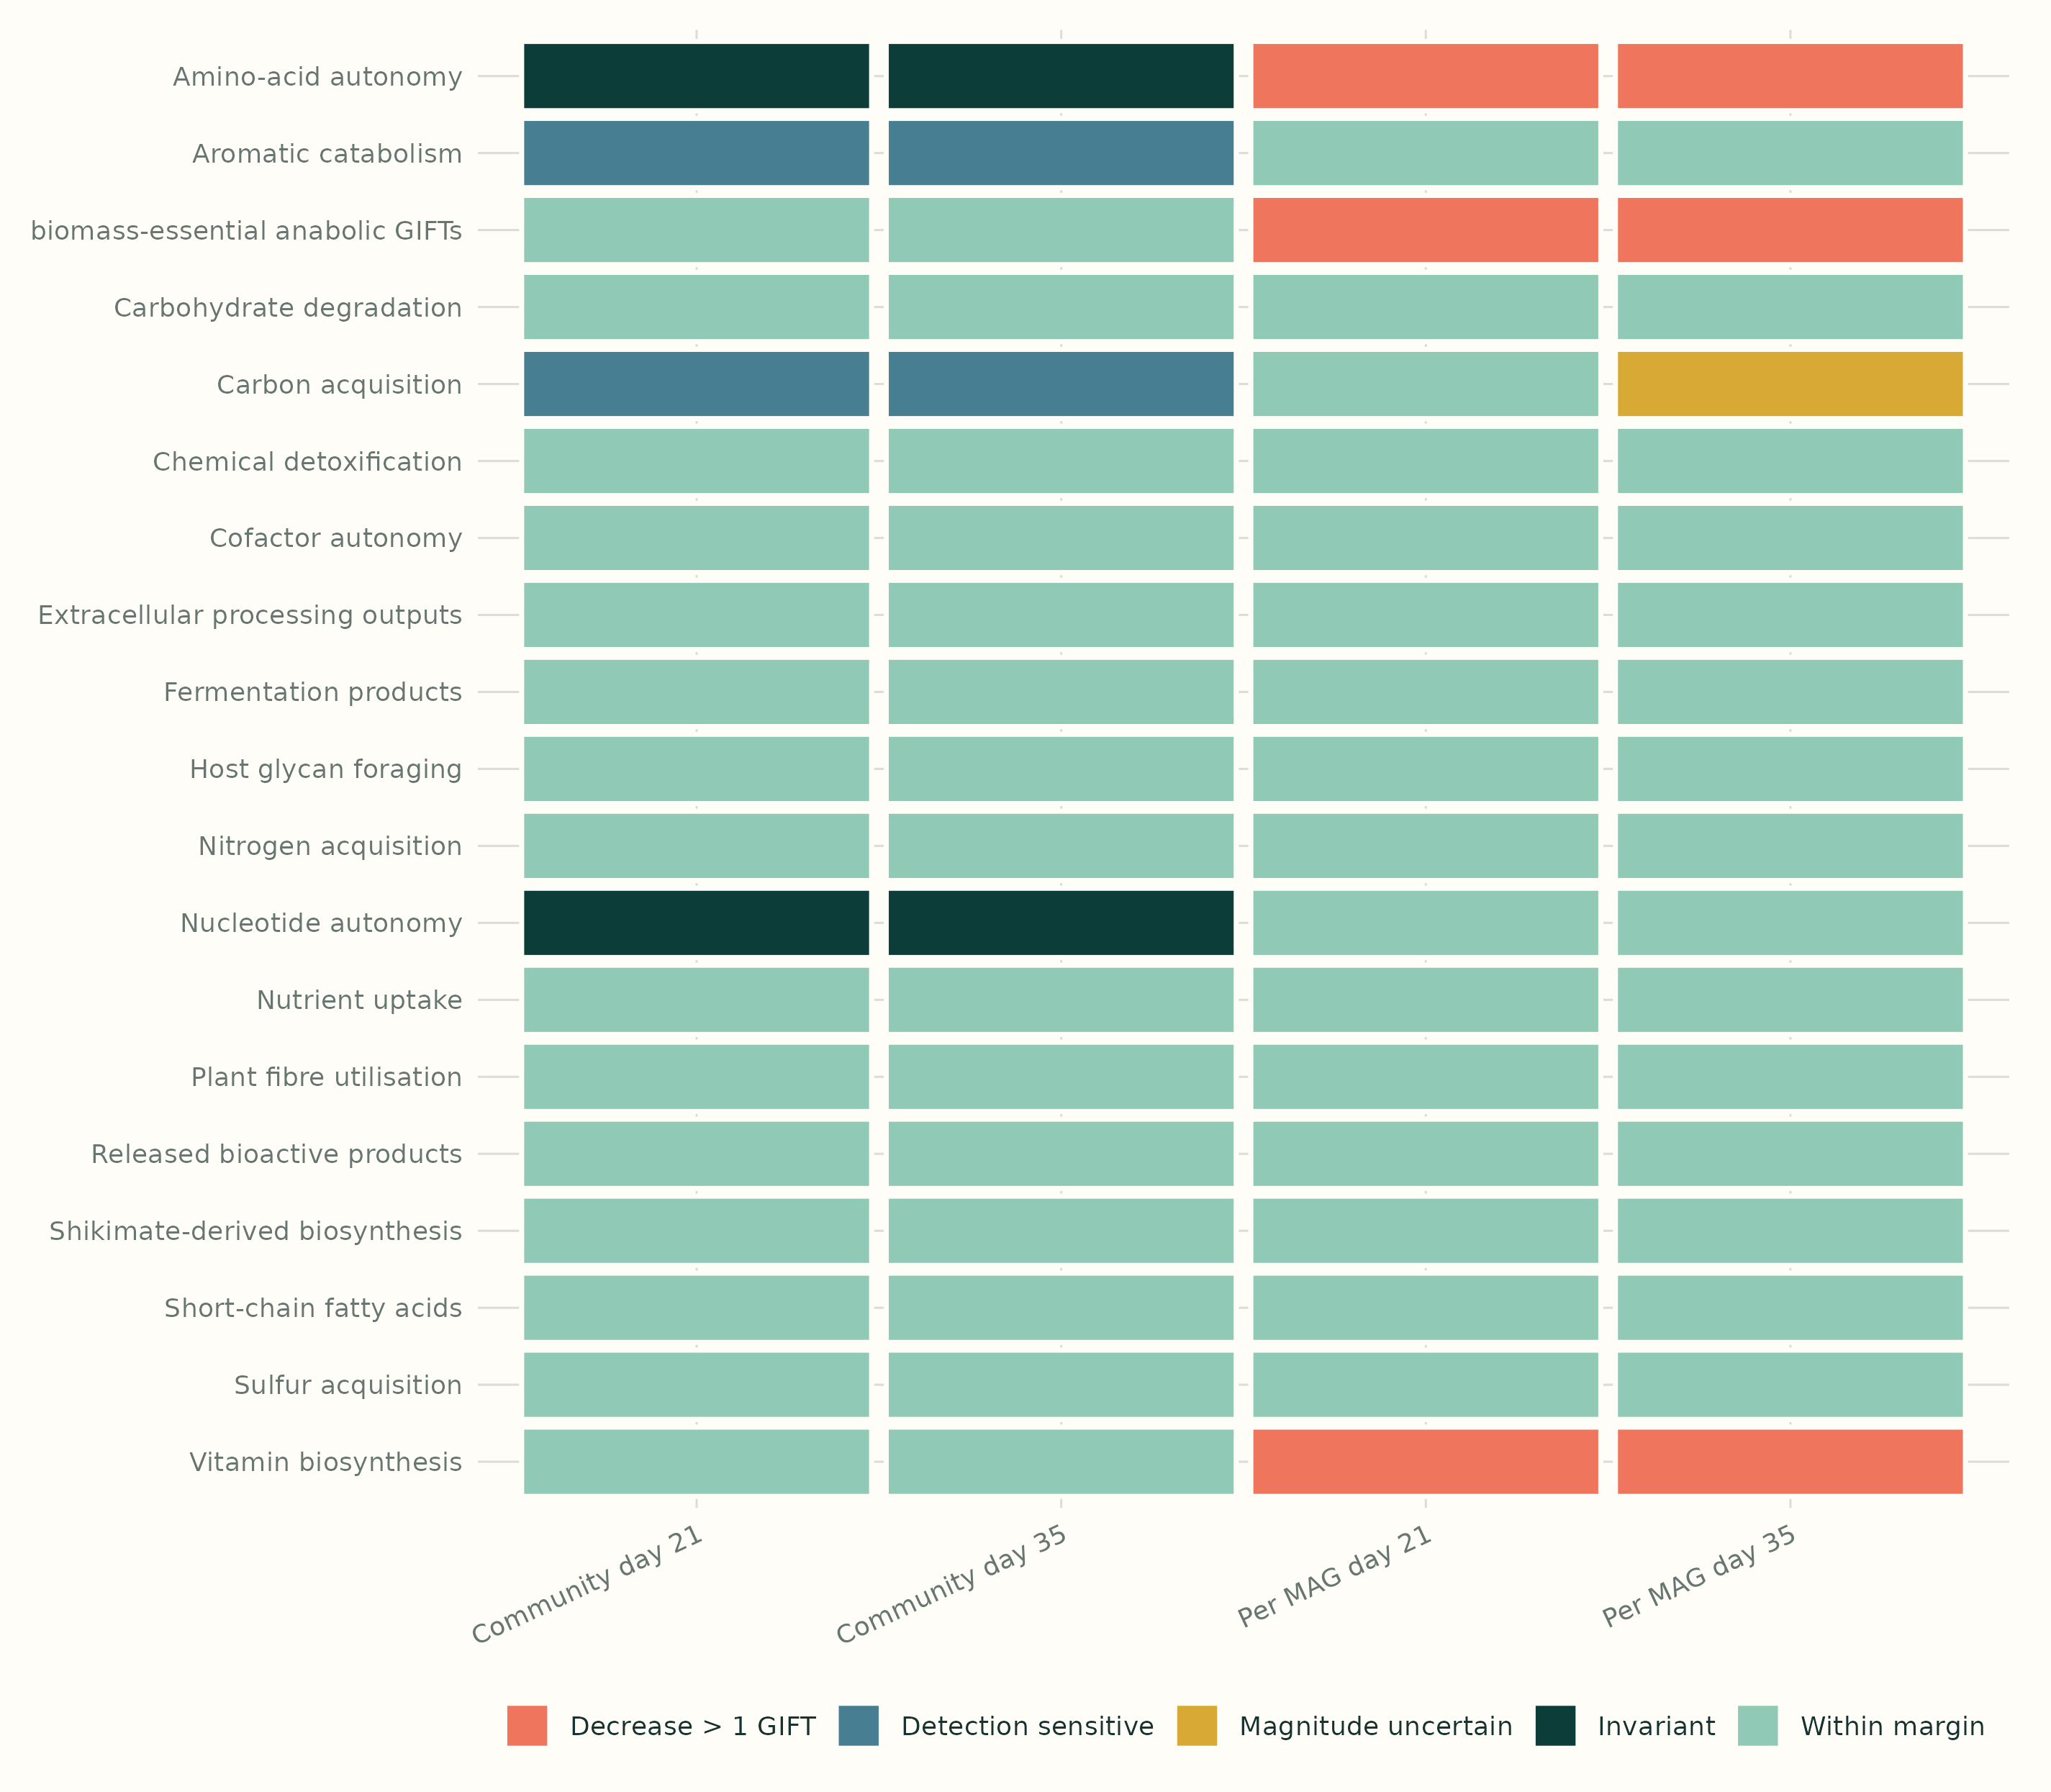
Classification of adjusted day-21 and day-35 changes from day 7 for all 19 curated frames. Community union and mean per-MAG richness are separate metrics. The colour describes a model and detection-sensitivity result, not a GIFT call or measured activity.
Fifteen frames had community richness within the one-GIFT margin at every threshold; amino-acid and nucleotide autonomy were exactly invariant. Aromatic catabolism and carbon acquisition were detection sensitive. All four bounded frames retained community coverage within five percentage points. The clearest per-MAG decreases were in amino-acid autonomy, biomass-essential anabolism and vitamin biosynthesis.
| Frame | Contrast | Adjusted difference | 95% interval |
|---|---|---|---|
| Amino-acid autonomy | day 21 − day 7 | -2.47 | [-2.73, -2.22] |
| Amino-acid autonomy | day 35 − day 7 | -3.32 | [-3.57, -3.07] |
| biomass-essential anabolic GIFTs | day 21 − day 7 | -3.67 | [-4.05, -3.29] |
| biomass-essential anabolic GIFTs | day 35 − day 7 | -4.78 | [-5.15, -4.41] |
| Vitamin biosynthesis | day 21 − day 7 | -1.50 | [-1.64, -1.37] |
| Vitamin biosynthesis | day 35 − day 7 | -1.91 | [-2.05, -1.78] |
The abundance-weighted reading sums the relative abundance coverage of each member GIFT within the detected community. It preserved all 6 negative age directions. 5 effects stayed beyond one GIFT; the day-21 vitamin result had an uncertain magnitude when weighted by abundance. Weighting changes how an encoded repertoire is summarised; it does not measure expression or flux.
Why community richness forms two bands
At the primary threshold, 78 samples held 88–97 metabolic GIFTs and 310 held 108–119. The detected status of cmag_510, an Escherichia coli MAG, matched the split in all 388 samples. It encoded 90 metabolic and 11 plant-fibre GIFTs.
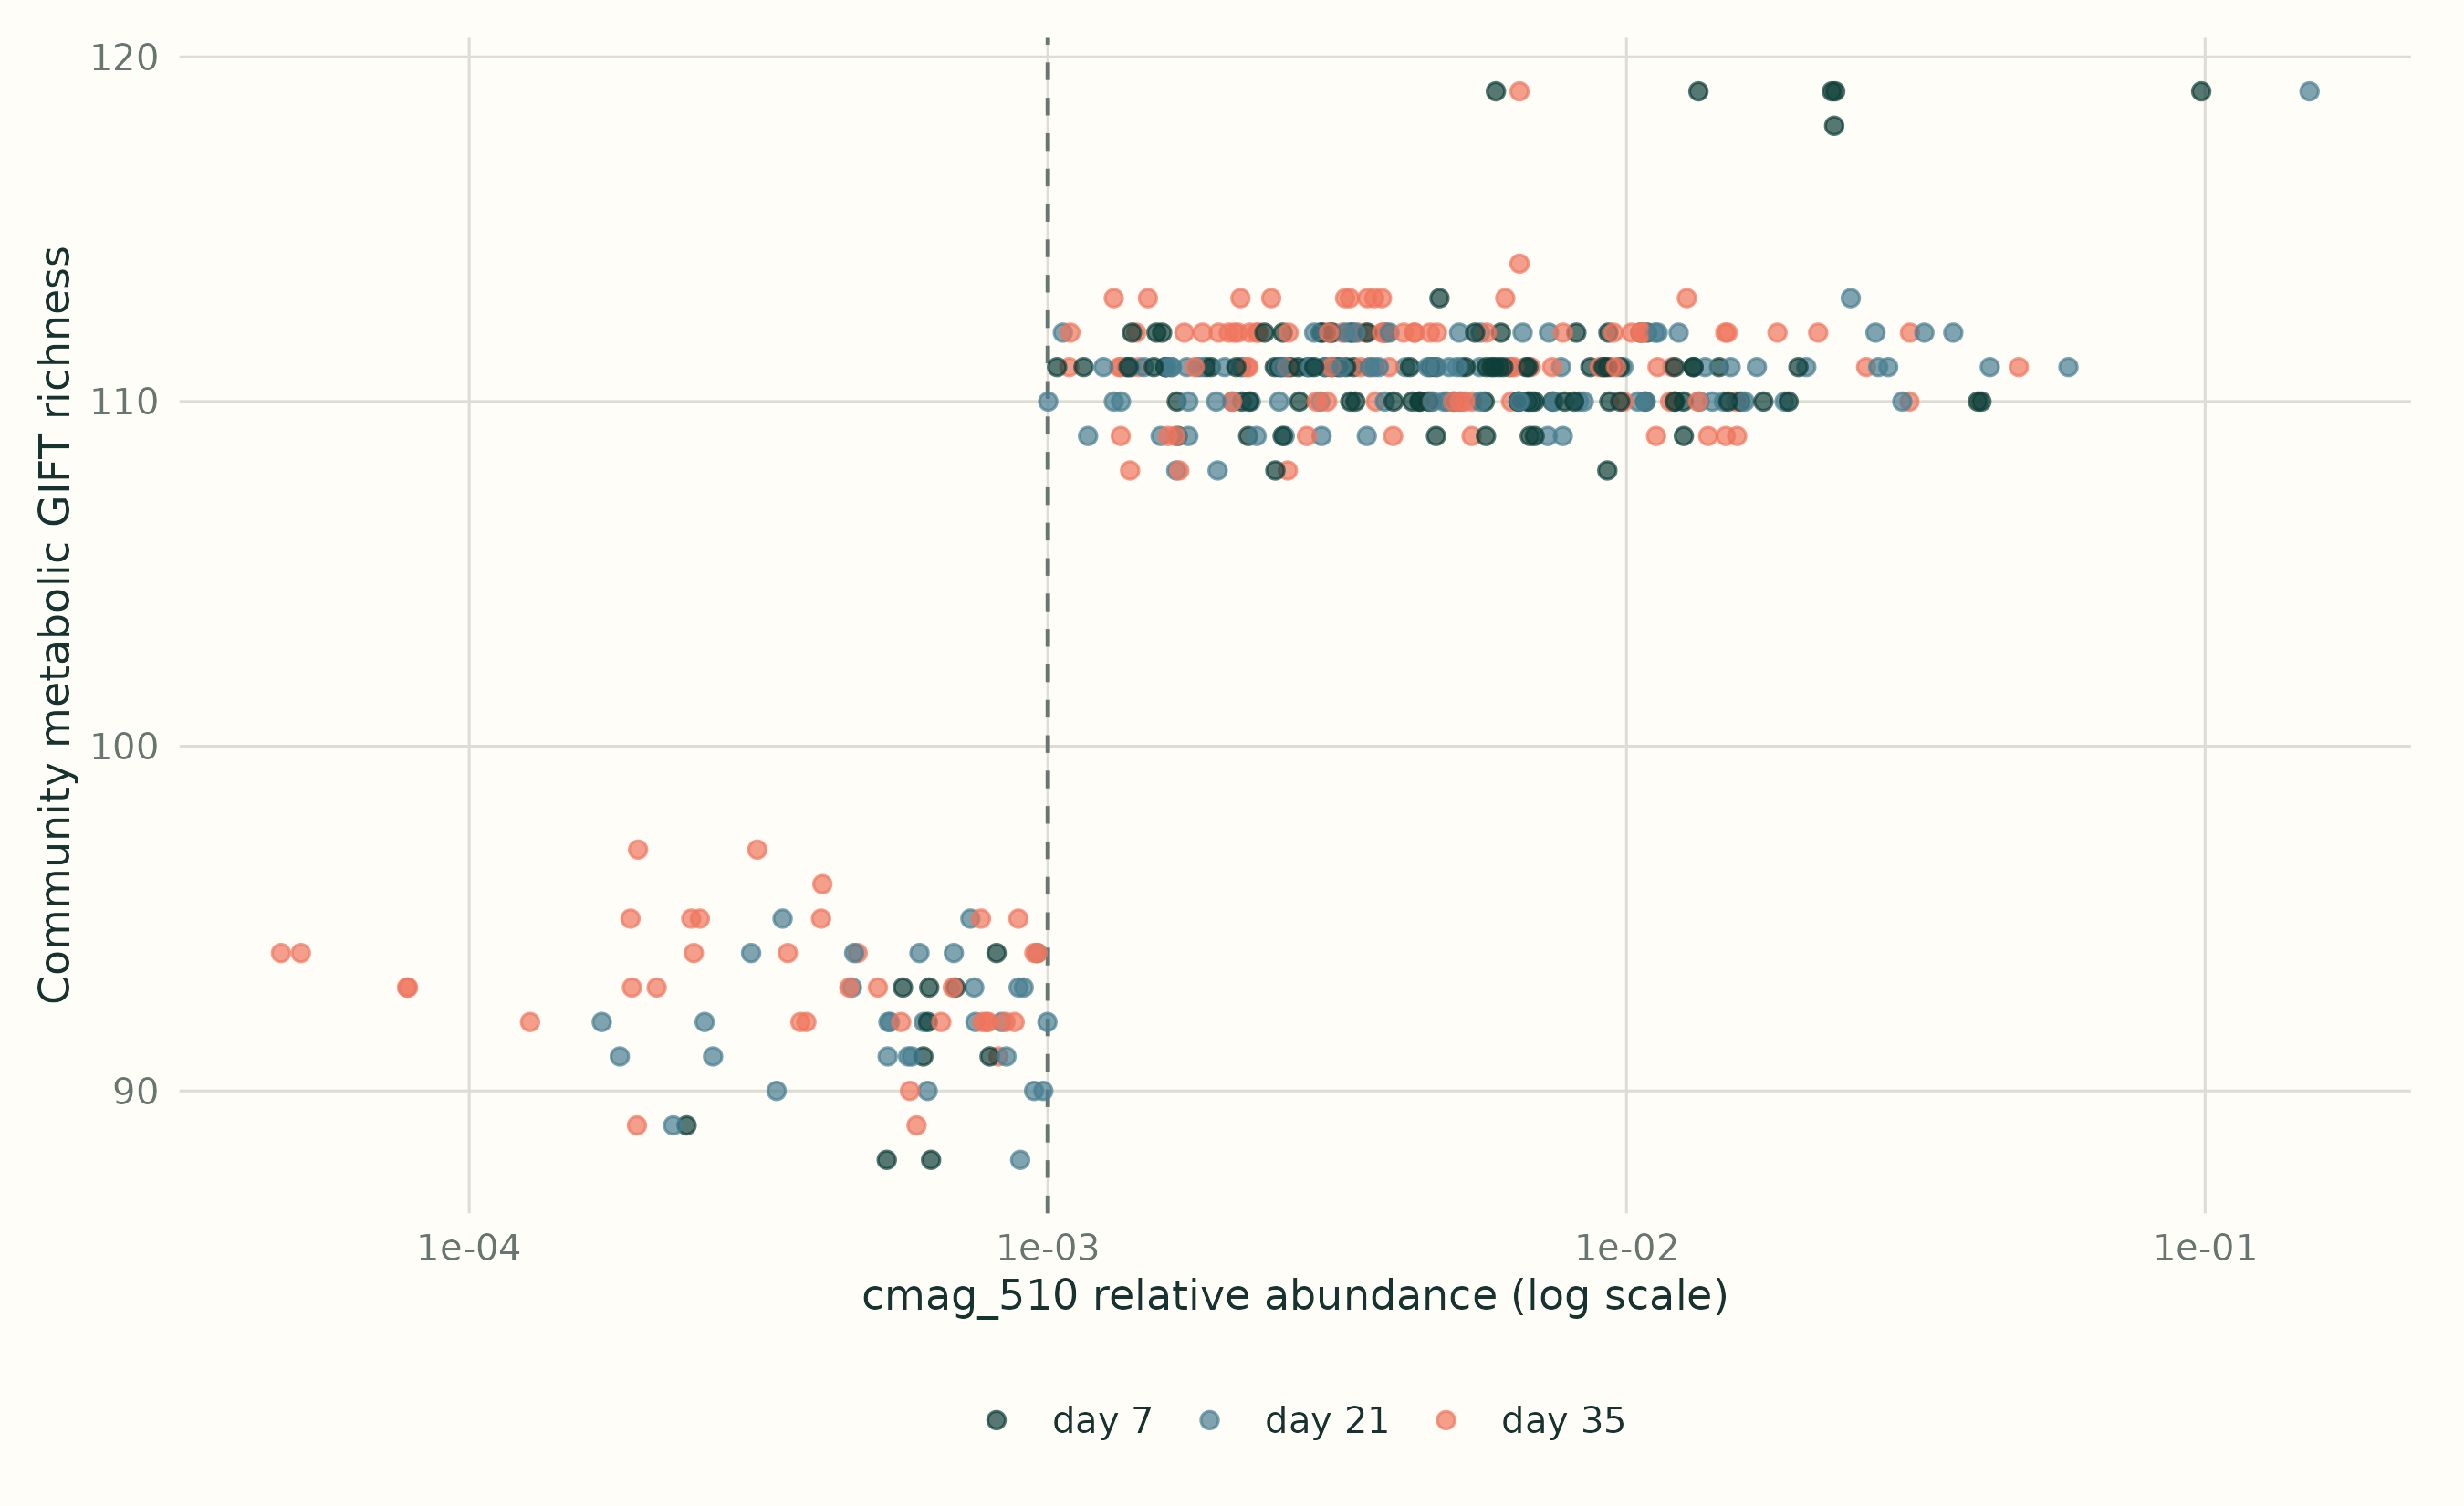
Each point is one sample. The dashed line is the operational detection cutoff of relative abundance > 0.001 for cmag_510. The apparent two-band richness pattern follows whether this broad-repertoire MAG lies above the cutoff; abundance remains continuous.
Computationally removing this MAG’s calls reduced median metabolic richness to 92 in the lower band and 92 in the upper band. Its median abundance fell from 0.00456 at day 7 to 0.00286 at day 35, moving more samples below the cutoff. At a threshold of 0.00001 it was detected in every sample. The bands are thus a sensitivity of a binary community union to detection, not two measured functional states.
Exact potential handoffs
A cross-genome link requires two GIFTs to share a declared extracellular anchor exactly. The catalogue at this database version yielded only 3 such links:
| Provider | Extracellular anchor | Recipient |
|---|---|---|
| arabinoxylan debranching | ARABINOSE_EX | arabinose uptake abc |
| arabinoxylan debranching | XYLAN | xylan degradation |
| xylan degradation | XYLOSE_EX | xylose uptake abc |
Median potential-handoff density was 0.294, 0.213 and 0.205 at the three ages. The day-21 and day-35 adjusted density differences from day 7 were -0.080 and -0.086. The direction remained negative across detection thresholds and after subtracting a null mean from 499 random catalogue communities matched for detected-MAG count. With ambiguous marker evidence withheld, absolute density was much lower, but the age direction did not reverse. Potential links are constrained by the three curated extracellular paths; they do not show that molecules moved between organisms.
A later comparison with genome size
The phylogeny case study provides a size expectation from 696 complete genomes. A later R10 analysis applied it to these MAGs using database 2026.37.1 and 163 GIFTs. This is a separate reevaluation from the 156-GIFT result above; the 156 shared GIFTs even have 130 changed MAG calls. Its estimates must stay with its database release.
In that later reading, the adjusted day-35 per-MAG metabolic difference from day 7 was -8.86 GIFTs. The GTDB size expectation reproduced -5.49 of that difference (62%), leaving a -3.37-GIFT deviation. Genome size thus explains part of the narrower per-MAG repertoire, while the remaining difference stays visible. It does not change any original call or turn a size association into a functional mechanism.
Reannotating the same MAGs with giftag
We reannotated the same checksum-verified 822 assemblies with giftag and evaluated its marker output with the current gifter database. For a fair call comparison, we also reevaluated the original Drakkar markers on that same database (2026.39.1, SQLite SHA-256 2aaecf7ef6cbb7531baf1d160ab5abbcc60c922463e21e2200100564c7d32987). This pair is separate from the original 156-GIFT reading above: the later catalogue has 163 GIFTs. Neither annotation changes a genome call after evaluation; the same fixed calls are read across the 388 samples.
The two evaluations support 23,657 Drakkar and 24,181 giftag MAG–GIFT pairs. Their overlap and differences are:
| Type | Shared | Drakkar only | giftag only | Jaccard (%) |
|---|---|---|---|---|
| All GIFTs | 23,002 | 655 | 1,179 | 92.6 |
| metabolic | 21,797 | 558 | 1,163 | 92.7 |
| structural | 32 | 4 | 5 | 78.0 |
| regulatory | 44 | 21 | 3 | 64.7 |
| defense | 1,129 | 72 | 8 | 93.4 |
The 822-MAG comparison includes cmag_103, which has no supported GIFT in either reading. A zero-call MAG remains in the denominator and is not dropped because it has no positive call.
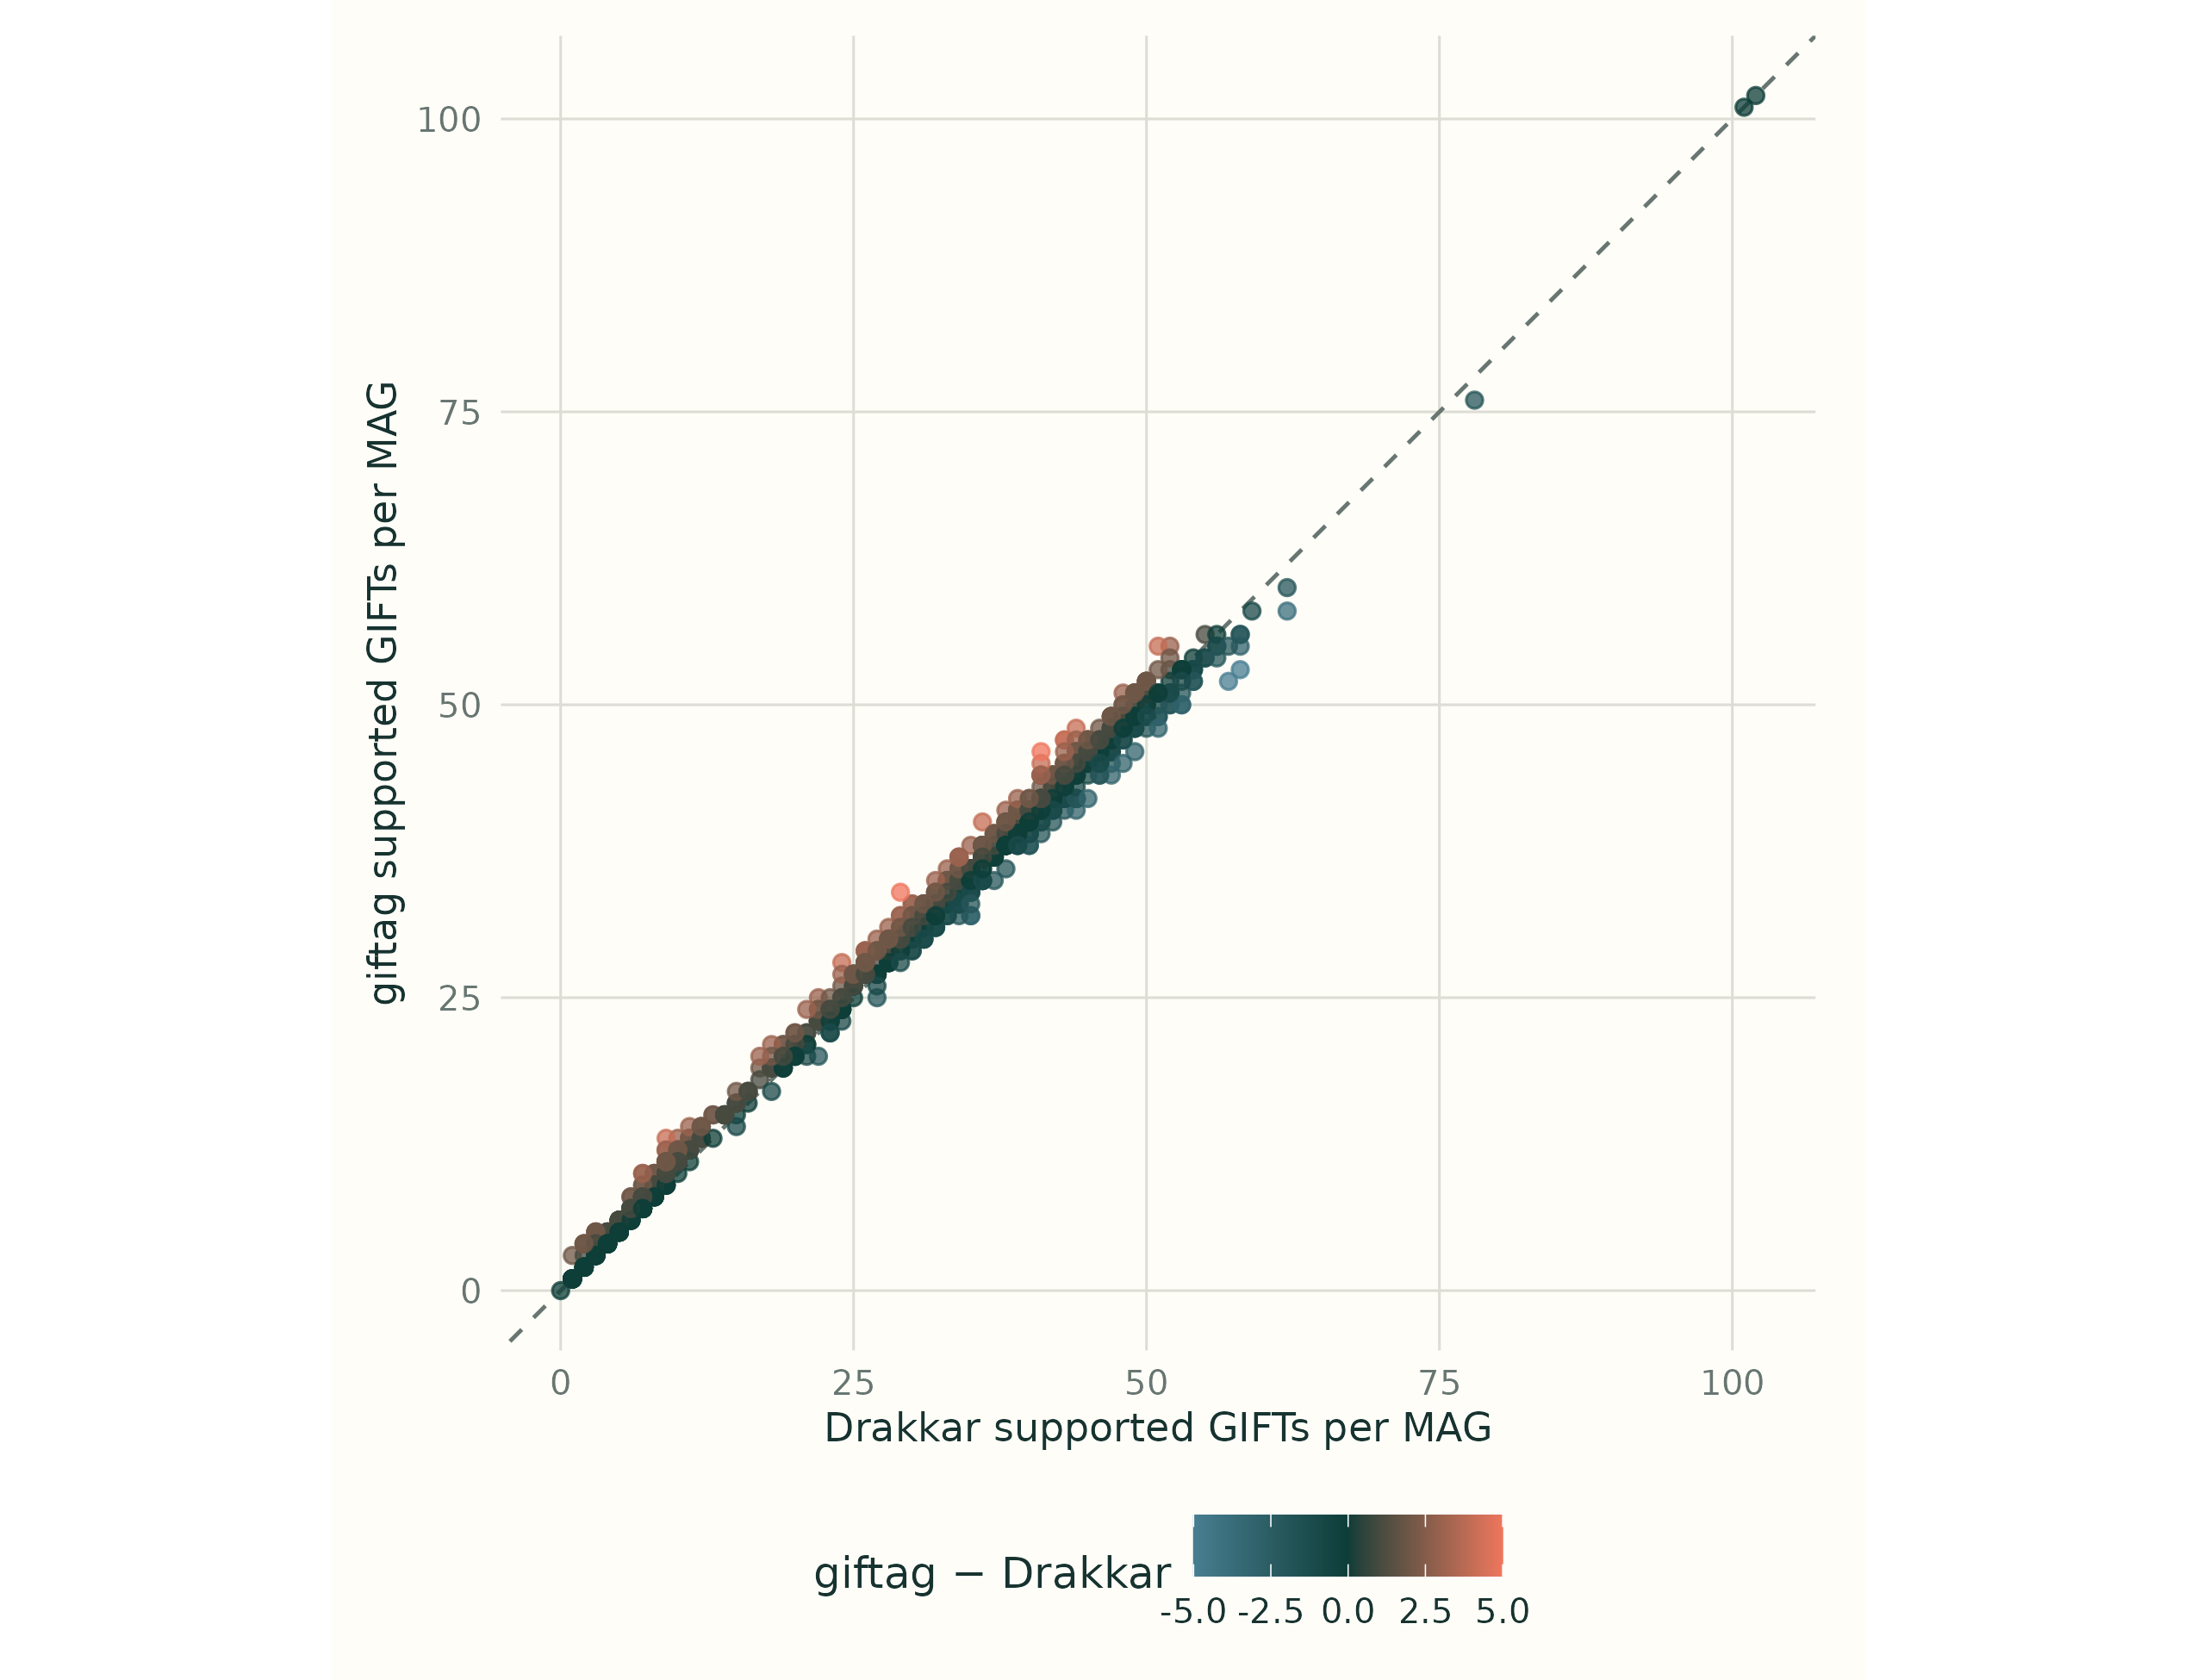
Supported GIFT counts for the same 822 MAGs, with both annotations evaluated on database 2026.39.1. Each point is a MAG. The diagonal marks equal counts, not equal sets of GIFTs; the call-level table above shows where the sets disagree. The zero-call MAG lies at the origin.
The marker inputs have different scope. Drakkar projected 11,219,684 rows from broader annotation resources; giftag emitted 133,678 rows from profiles targeted to gifter’s vocabulary. The raw row counts are therefore not comparable as marker recovery. Within that vocabulary, KO genome–marker presence had 96.7% Jaccard, while CAZy had 49.7%. Gene prediction, profile releases and hit thresholds also differ, so neither annotator is a ground truth for the other.
What changes in the sample reading
| Metric | Drakkar: days 7 / 21 / 35 | giftag: days 7 / 21 / 35 |
|---|---|---|
| Community metabolic richness | 111 / 110 / 111 | 111 / 110 / 111 |
| Mean metabolic GIFTs per MAG | 38.09 / 30.36 / 28.90 | 39.00 / 31.14 / 29.63 |
| Mean plant-fibre GIFTs per MAG | 2.19 / 1.84 / 1.81 | 3.37 / 2.91 / 2.85 |
| Exact handoff density | 0.294 / 0.213 / 0.205 | 0.548 / 0.408 / 0.406 |
At the primary threshold, only 7 of 388 samples changed their community metabolic richness between annotators; the largest difference was one GIFT. Mean per-MAG metabolic richness changed in all 388 samples, by an average of 0.77 additional GIFTs with giftag. Its adjusted day-21 and day-35 differences from day 7 remained negative: -6.82 and -8.93 GIFTs. Thus the contrast between a broad community union and narrower encoded member repertoires survives this annotation change.
The absolute handoff-density reading is more annotation sensitive: its giftag medians are higher at every age. Among the discordant calls, giftag additionally supports xylan degradation in 187 MAGs and arabinoxylan debranching in 63. The three declared extracellular links themselves are unchanged. The number of compatible MAG pairs depends on which markers an annotation finds; neither density is an observation of molecular exchange.
The measured giftag annotation stage took 4.01 hours with eight requested CPUs. The recorded Drakkar workflow spanned 17.20 hours with up to 100 concurrent Slurm jobs. Their source coverage and compute arrangements differ; these are practical workflow measurements, not a same-task algorithm benchmark. The original 19-frame temporal follow-up and single-MAG richness-mode diagnostic above remain readings of the original Drakkar calls; this giftag rerun repeated the primary R10 sample and age analysis only.
Resources for the gifter reading
We measured the gifter portion of this workflow on the same 822 MAGs and 388 samples using database 2026.39.1. The input contained 11,219,684 gene–marker rows. On an eight-core Apple M3 laptop with 16 GB RAM, one evaluation worker took 22.8 minutes end to end, with 3.85 GB peak sampled resident memory. Eight workers took 14.2 minutes. Genome evaluation accounted for 22.3 minutes of the single-worker run; dataset assembly and the 11-frame primary sample-trait reading each took under one second, while the exact plant-fibre network took 14.5 seconds.
These are single measured runs, not a scaling guarantee. Aggregate worker memory could not be measured in the eight-worker run. The timings exclude upstream gene calling and marker annotation, statistical models and figure rendering. The measurement tables retain the input and database checksums, stage timings, CPU use and memory samples.
Reproduce this analysis
The analysis directory contains the scripts, committed result tables and input manifests. The R10 case directory pins the public archive, checksums, annotation transfer and detection limits. Large marker inputs stay outside git; the scripts verify them before use.
| Script | What it contributes |
|---|---|
21-r10-chicken.R |
MAG calls, sample traits, age models and primary case figure |
22-r10-handoff-bimodality.R |
Richness-band diagnosis, exact extracellular links and matched null |
24-r10-reference-frame-time.R |
All curated frames, equivalence decisions and abundance weighting |
31-r10-size-expectation.R |
Separate current-database comparison with the GTDB size expectation |
36-r10-gifter-resources.R |
Gifter evaluation, dataset and network resource measurement |
33-r10-giftag-compare.R |
MAG–GIFT and sample-metric concordance on one database |
34-r10-giftag-markers.py |
Genome-marker concordance within the marker vocabulary |
35-r10-giftag-resources.py,
36-r10-giftag-genome-timing.py
|
Annotation resource and per-MAG timing audits |
Every plot here is drawn from the committed tables; the site build performs no annotation, GIFT evaluation or statistical refitting. For an individual sample, its GIFT calls and denominators can be inspected through the multi-sample dataset workflow.