
How much of what a bacterium encodes is set by the size of its genome, and how much by its lineage? This case study evaluates the whole GIFT catalogue on 696 complete genomes that span every eligible order of the GTDB bacterial tree.
In short
- Genome size alone explains 68% of the variation in how many GIFTs a genome supports.
- What remains is lineage: related genomes sit above or below the size expectation together (Pagel’s λ = 0.94).
- Catabolic capabilities follow genome size more closely than biosynthetic ones, and are scattered more widely over the tree.
- Where a genome is one requirement short of a GIFT, the same requirement is usually the one missing, which gives us a ranked list of GIFT definitions to revisit.
If you have not yet read what a GIFT call claims, start with a single genome.
The genome panel
The panel was drawn from the 12,094 species representatives of GTDB R11-RS232 that are complete assemblies and tips of the bac120 reference tree. A genome was eligible when its isolation source could be assigned to at least one origin group, which left 4,116 candidates. Selection then ran in two steps, without looking at any annotation or GIFT call:
- One genome per order. The phylogenetic medoid of each of the 321 eligible orders, so that no order is missing.
- Balanced origins. Further genomes were added until every origin group reached 85 genomes, or all of its members if it had fewer, each time taking the genome that added the most phylogenetic diversity.
| Origin | Eligible | Selected |
|---|---|---|
| Food material, food-production environment, or fermentation process | 85 | 84 |
| Animal body, body site, excretion, clinical material, or animal-associated microbiome | 996 | 85 |
| Plant body, plant surface, rhizosphere, or plant-associated material | 446 | 85 |
| Fungal body, culture, or fungal-associated material | 6 | 6 |
| Algal body, phycosphere, or algal-associated material | 51 | 51 |
| Engineered system, wastewater, waste-treatment, or industrial material | 289 | 85 |
| Marine, coastal, brackish, or deep-sea environment | 588 | 85 |
| Freshwater, groundwater, or drinking-water environment | 403 | 85 |
| Soil or other terrestrial environment | 987 | 85 |
| Sediment, mud, or sand without forcing an aquatic system | 534 | 85 |
| Thermal or geothermal environment | 119 | 85 |
| Aquatic origin lacking a more specific water-body label | 749 | 87 |
| Air or built-environment surface | 49 | 49 |
The panel is deliberately enriched for breadth. Its numbers describe these 696 genomes and are not prevalence estimates for bacteria at large.
From annotation to calls
Each genome was annotated with giftag’s marker sources through Drakkar, which produced 16.9 million marker rows. The whole panel was then evaluated in one call, as a community of 696 genomes:
library(gifter)

# markers: one row per observed marker, with genome_id, gene_id, namespace
# and accession
calls <- evaluate_gifts_community(markers)
The result holds one row per genome and GIFT, 113,448 in total, each with its closest implementation, the requirements it lacks and the genes behind it. Everything below is read from that table (database 2026.37.1, gifter 0.7.3).
Repertoires across the tree
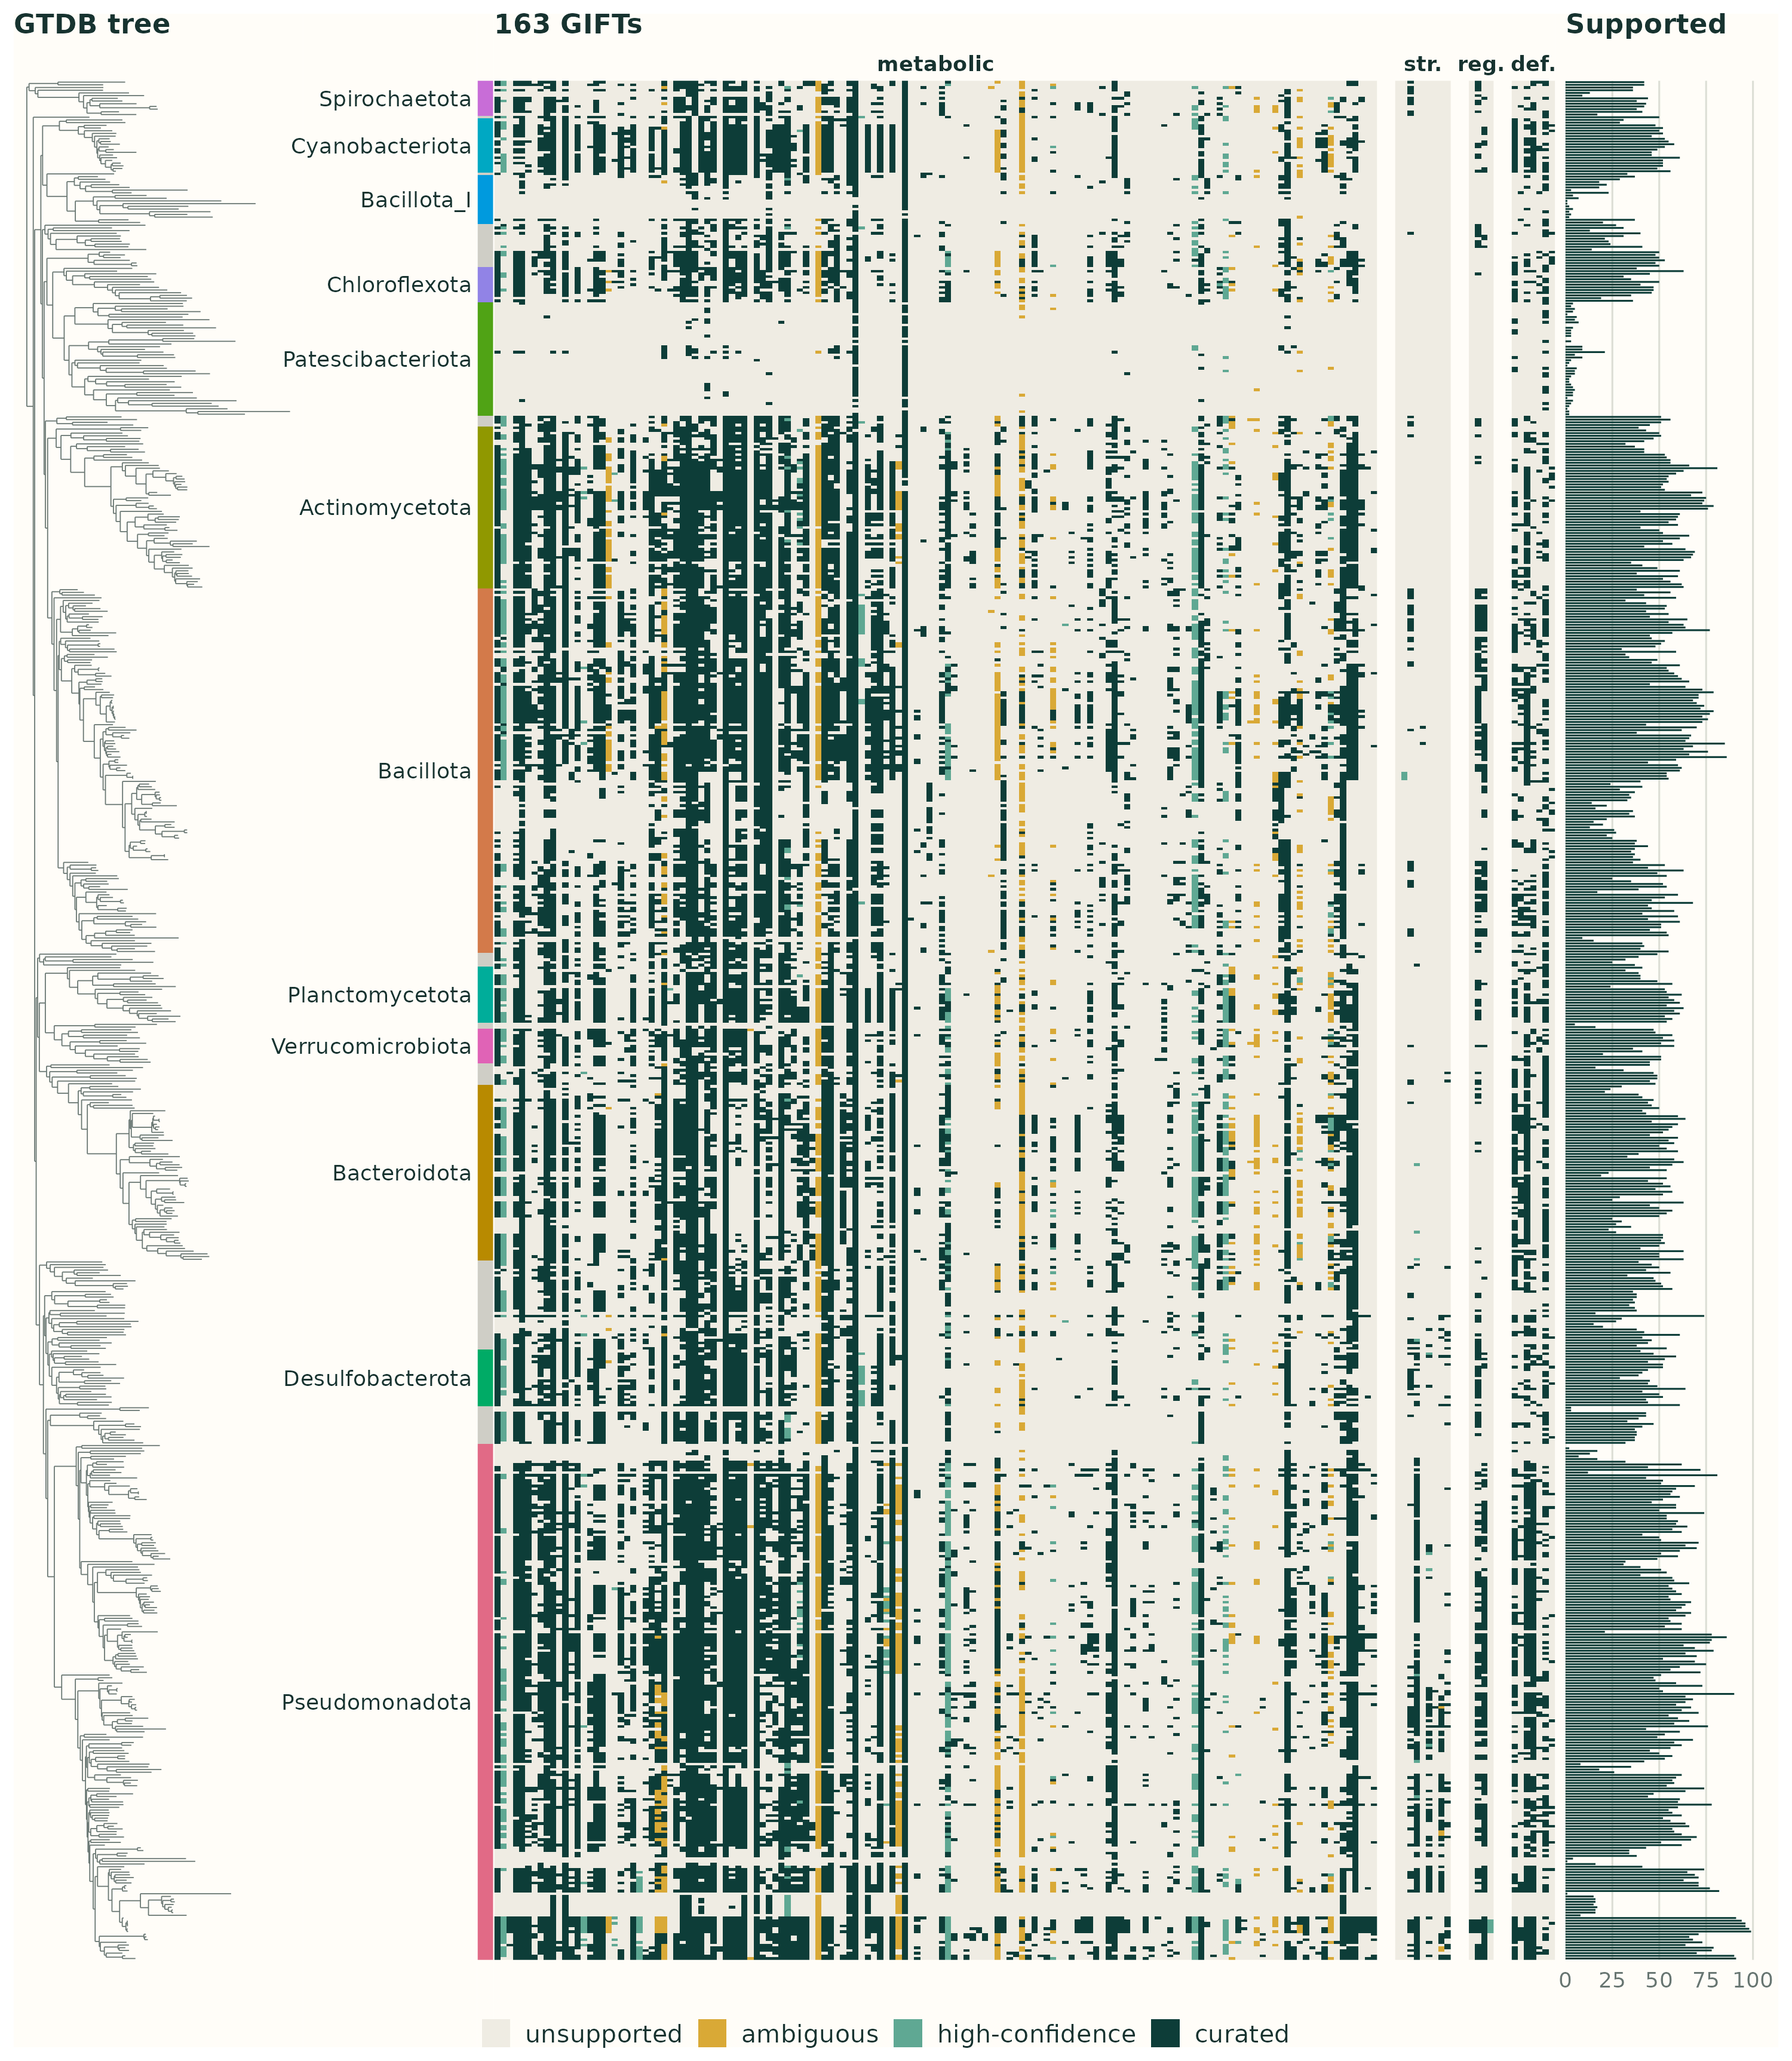
Every GIFT call of the panel. Rows are genomes in the order of the pruned GTDB tree, with the twelve largest phyla named; columns are GIFTs, grouped by type (metabolic, structural, regulatory, defense). A filled cell is a genome that supports a complete implementation, coloured by the confidence of its evidence. The bars count the supported GIFTs of each genome.
A genome supports a median of 50 of the 163 GIFTs, and the range runs from 0 to 99 (Enterobacter hormaechei_C). The catalogue is well exercised: 159 GIFTs are supported by at least one genome, and 90% of the supported calls carry curated evidence confidence.
The pale bands are the lineages with reduced genomes. The 42 Patescibacteriota support a median of 3 GIFTs, and the Bacillota_I lineage, which holds the mycoplasmas, a median of 5.5. At the other end, the largest repertoires belong to Pseudomonadota. Outside the reduced lineages some metabolic GIFTs form nearly solid columns, while many others appear only in patches of related genomes.
Genome size sets the expectation
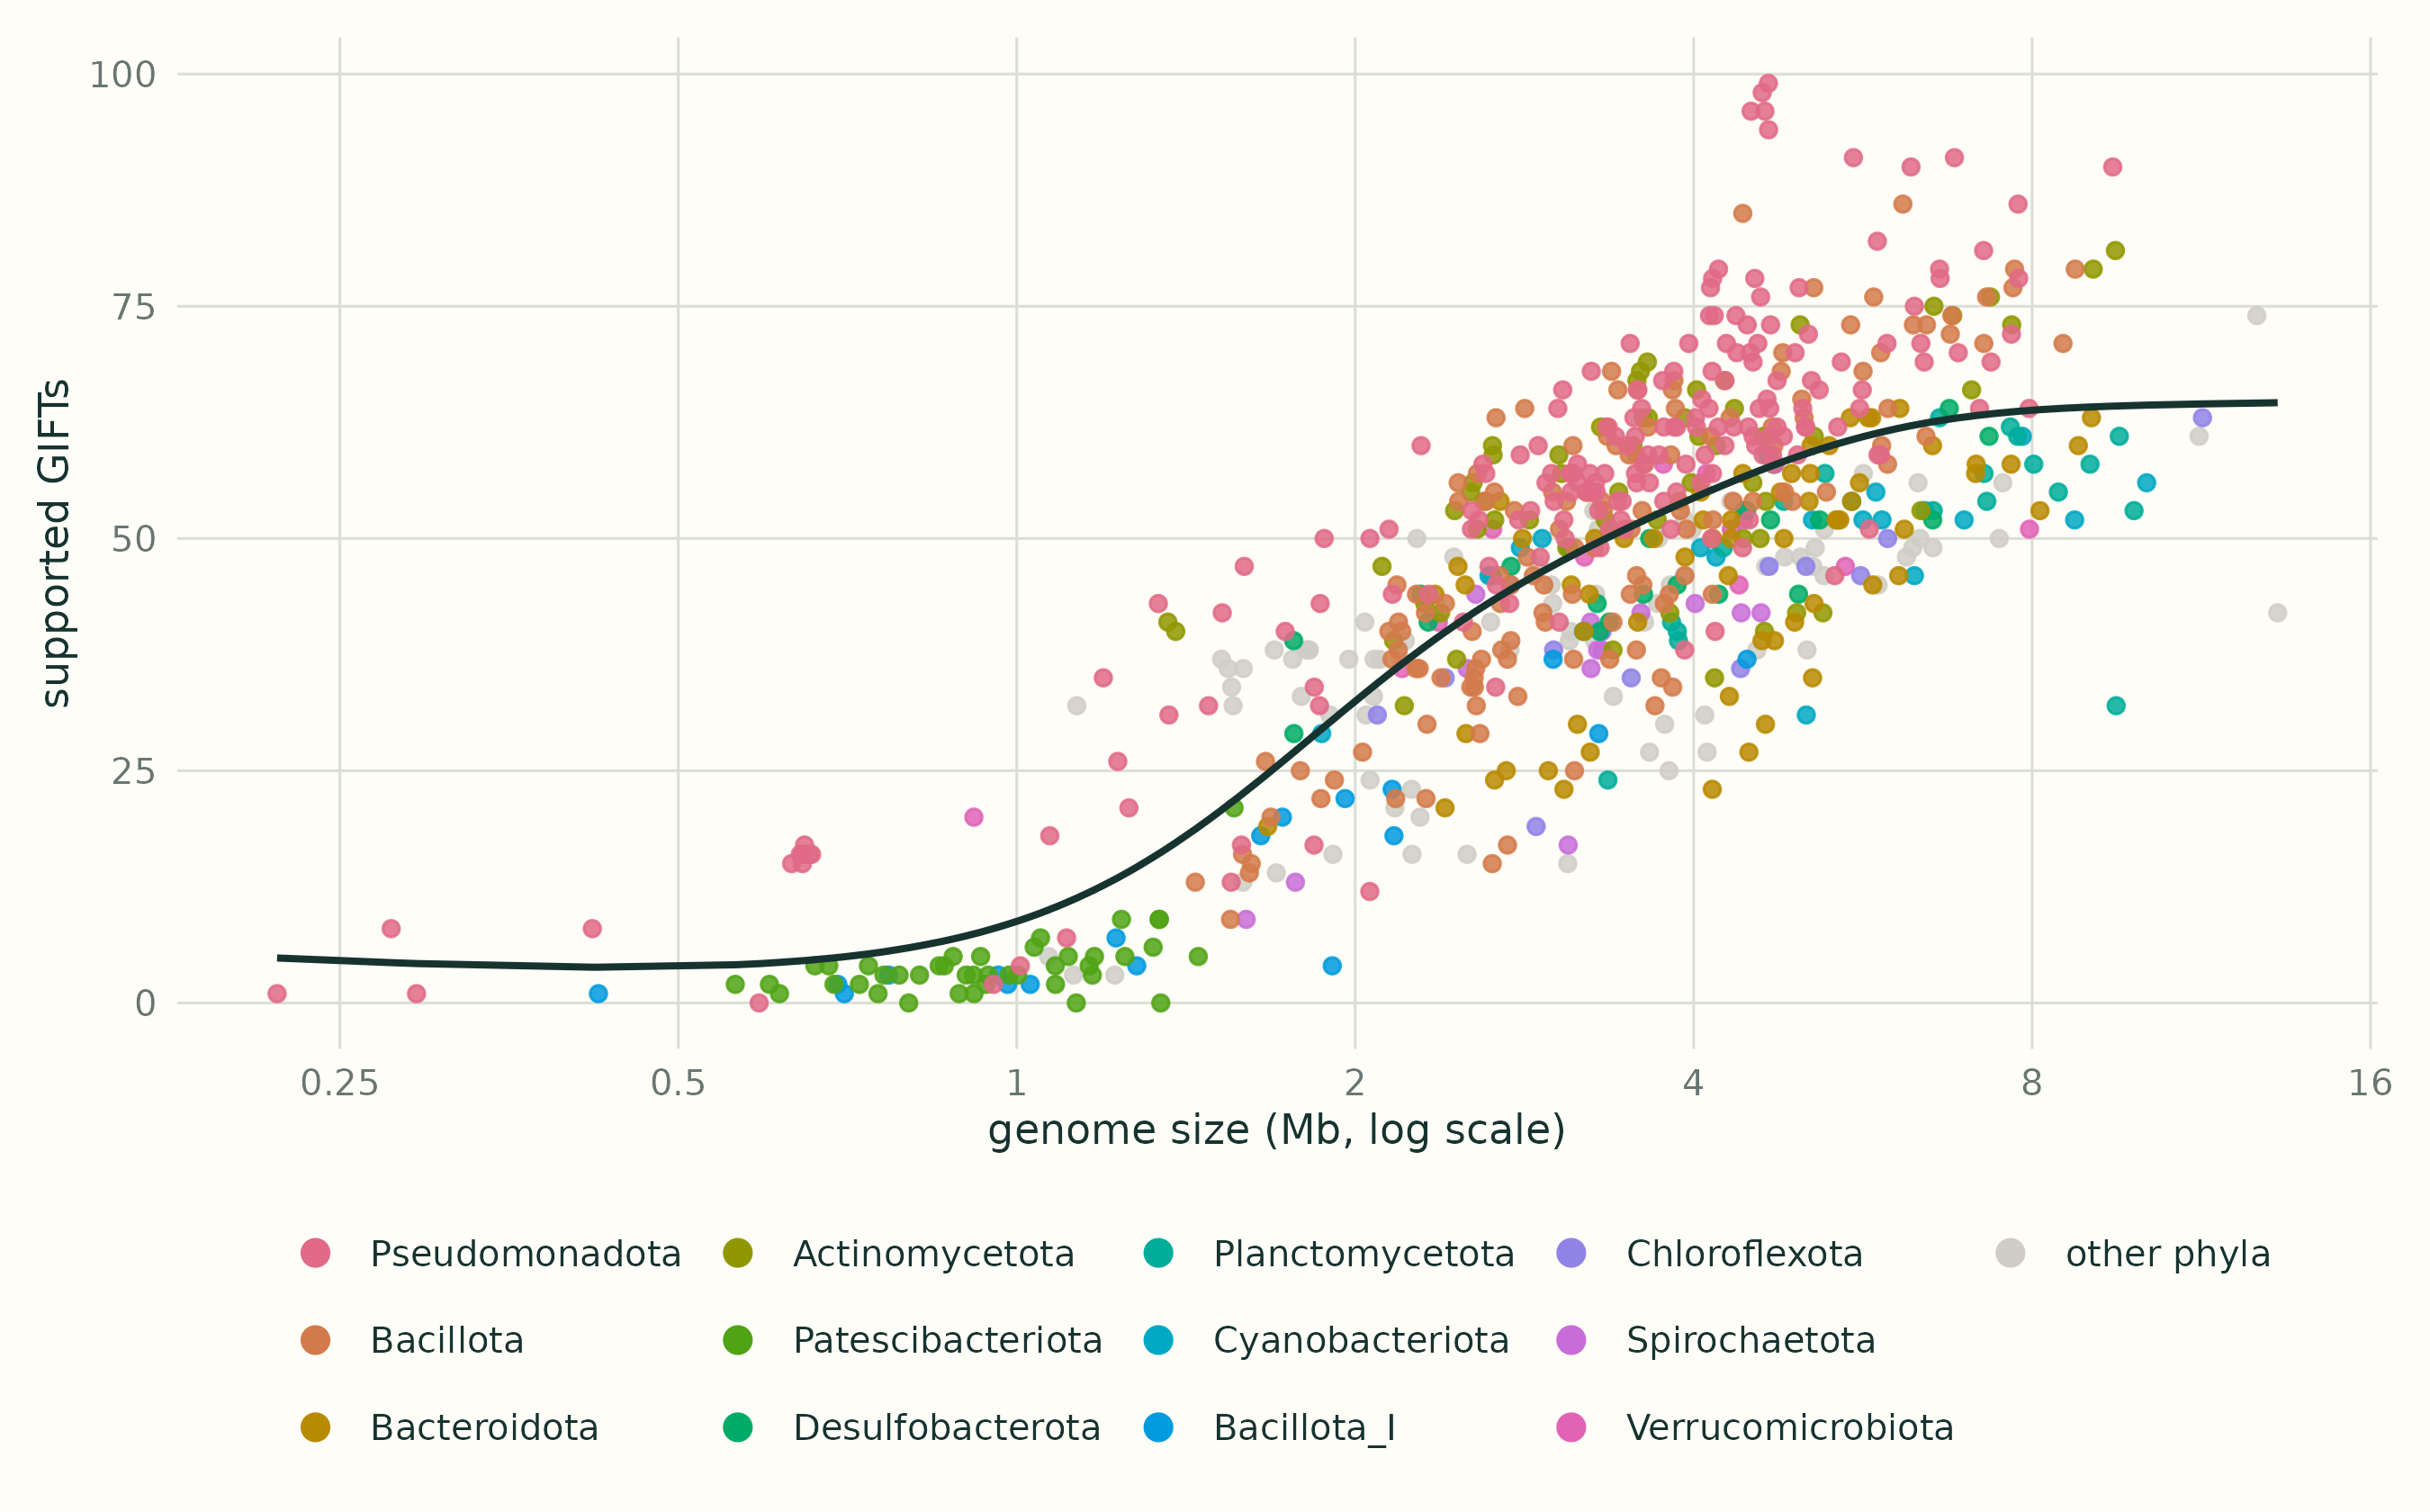
Supported GIFTs against the size of the evaluated assembly. Each point is a genome, coloured by phylum. The line is the expectation from a smooth model of the supported share of the catalogue given genome size.
The number of supported GIFTs rises with genome size (Spearman ρ = 0.73). The relationship is not a straight line. Below about 1 Mb genomes support almost nothing in the catalogue, between 1 and 5 Mb the repertoire grows steeply, and above that it levels off at around 65 GIFTs.
The fitted curve is the size expectation: the number of GIFTs a genome of that size supports on average in this panel. A genome’s deviation is the difference between what it supports and that expectation. No single genome departs from it significantly once the 696 tests are corrected for, but lineages do.
Lineages depart from it together
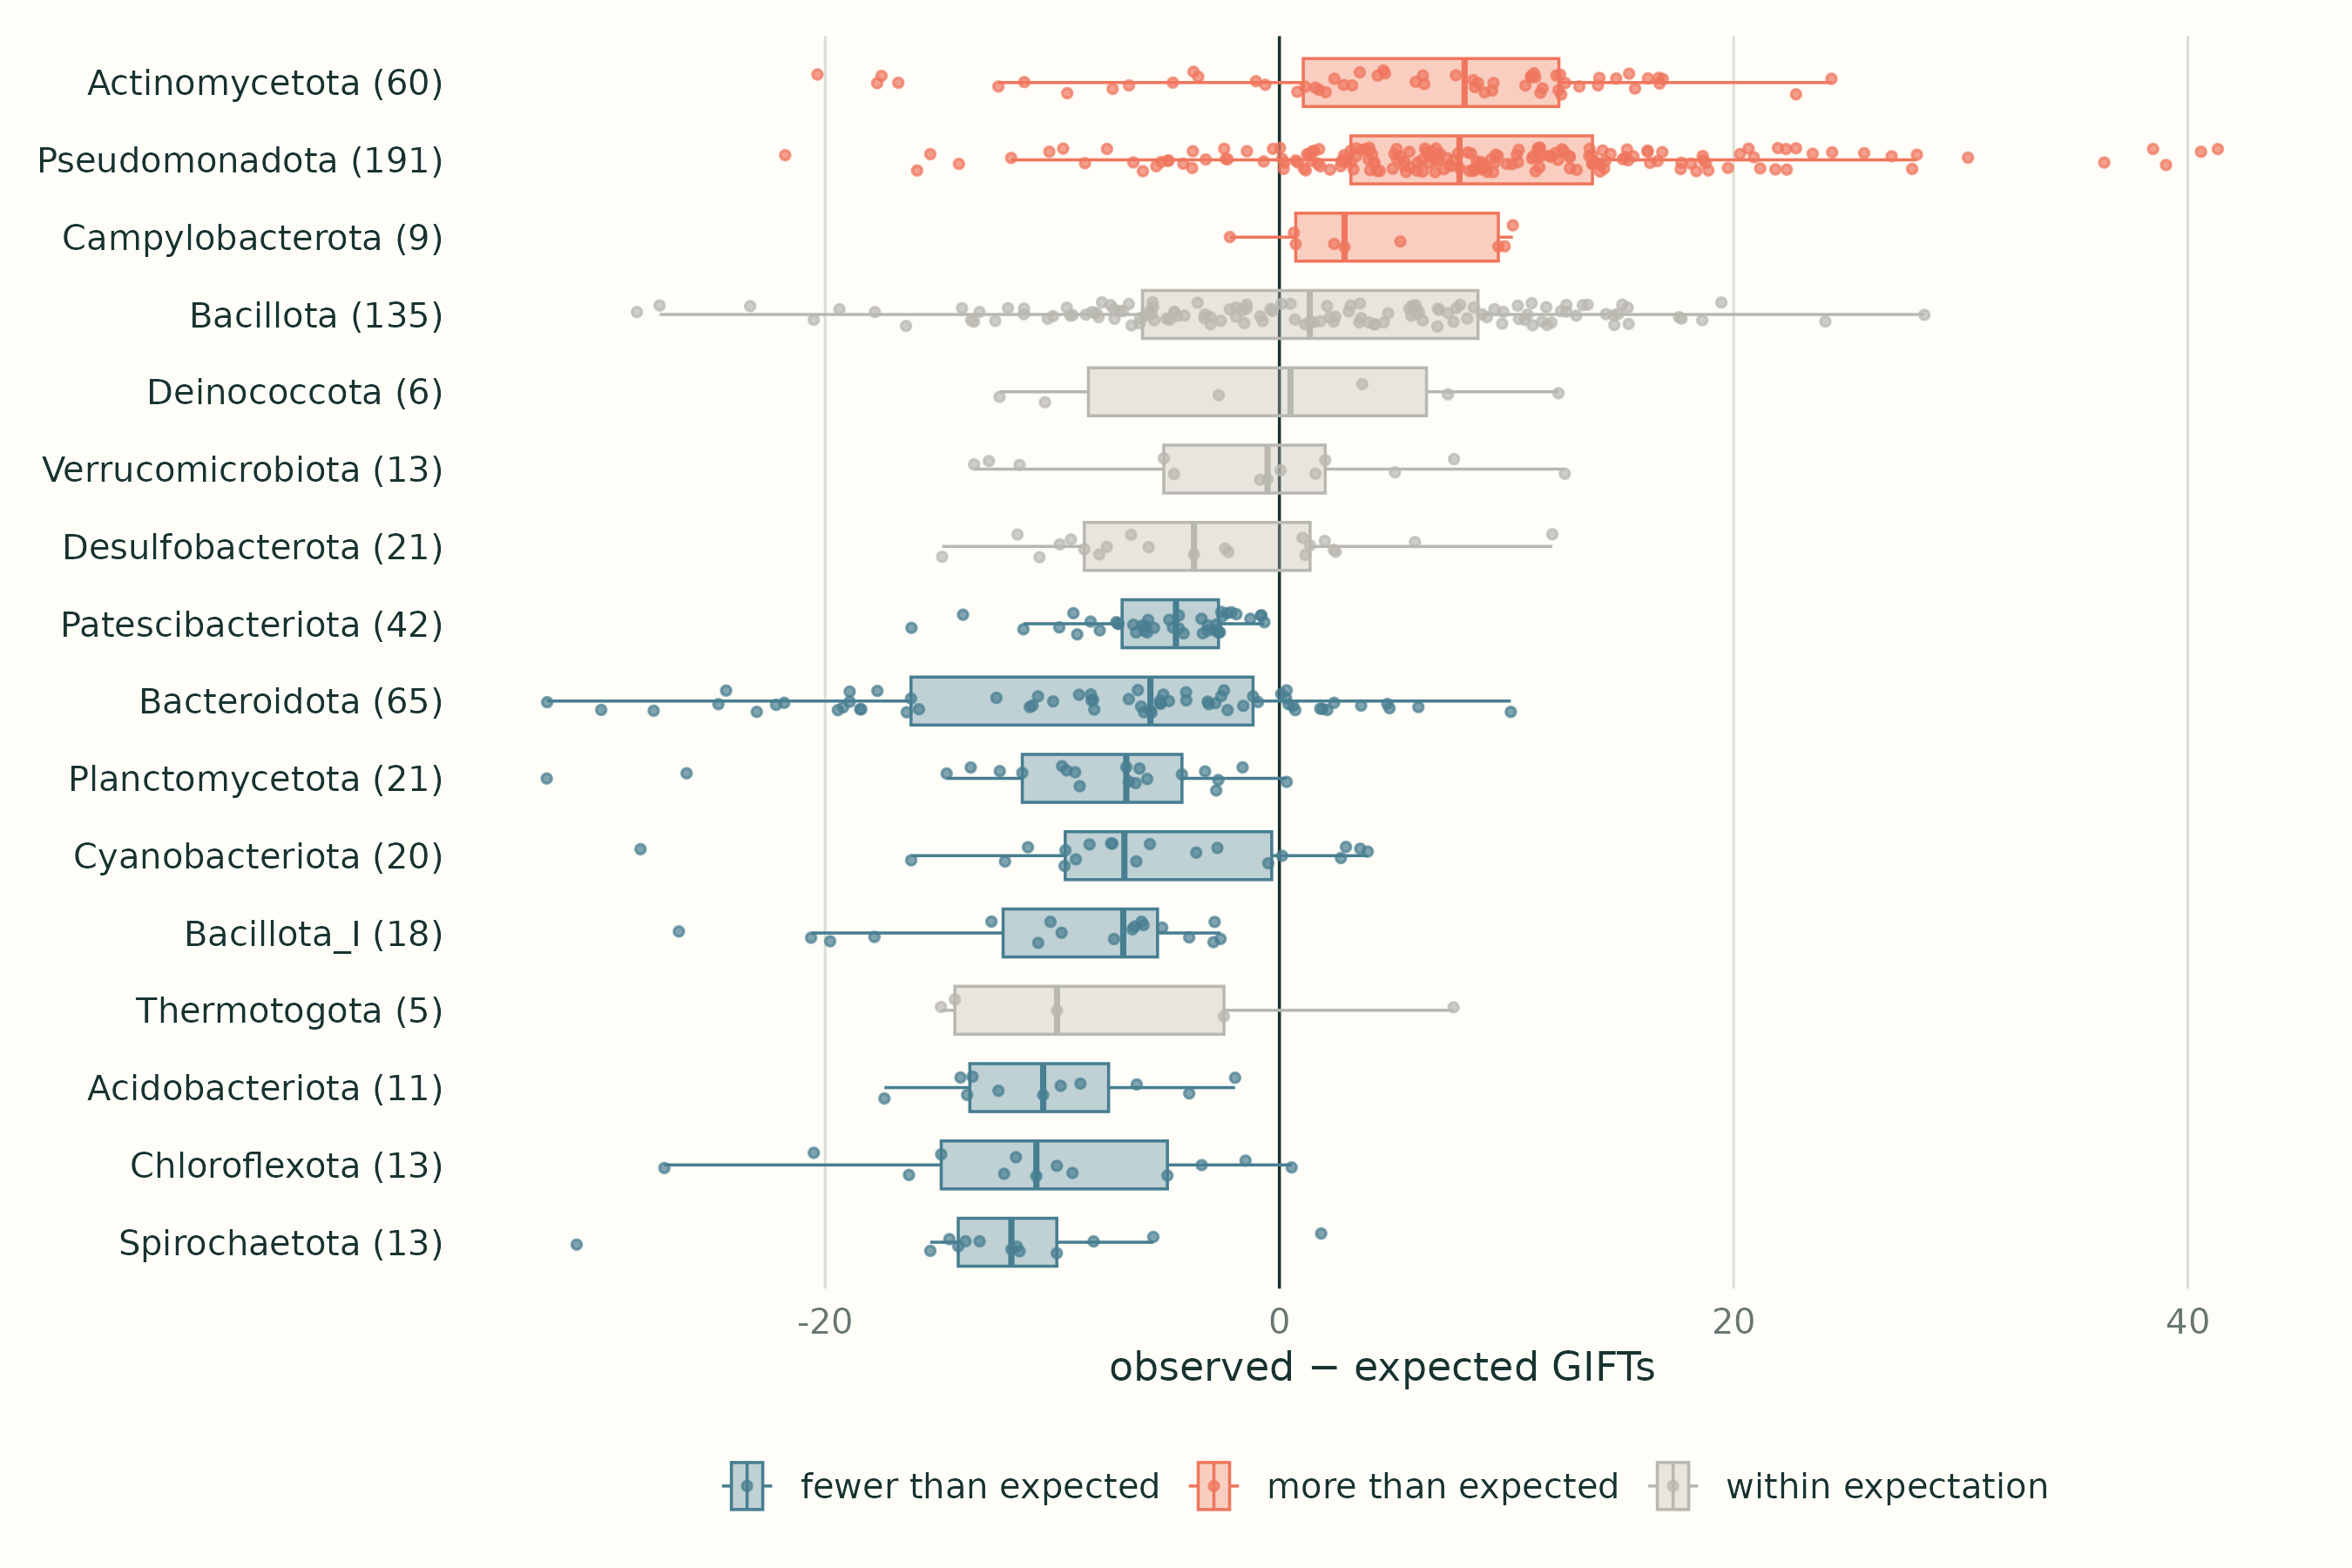
Deviation from the size expectation in each phylum with at least five panel genomes (count in brackets). A phylum is coloured when its genomes sit consistently above or below the expectation at a false discovery rate of 0.05.
Of the 16 phyla with at least five genomes, 3 support more GIFTs than their genome sizes predict (Campylobacterota, Actinomycetota, Pseudomonadota) and 8 support fewer. The deviation is strongly structured by phylogeny: Pagel’s λ is 0.94 and Blomberg’s K is 0.71, and genomes deviate in the same direction as their relatives out to a patristic distance of about 1.1 substitutions per site.
A phylum below the expectation does not necessarily encode less. We curated the catalogue mostly from the biochemistry of well-studied organisms, so a lineage that uses routes we have not curated yet will read as short. The last section looks at where genomes fall just short.
Which capabilities scale with size
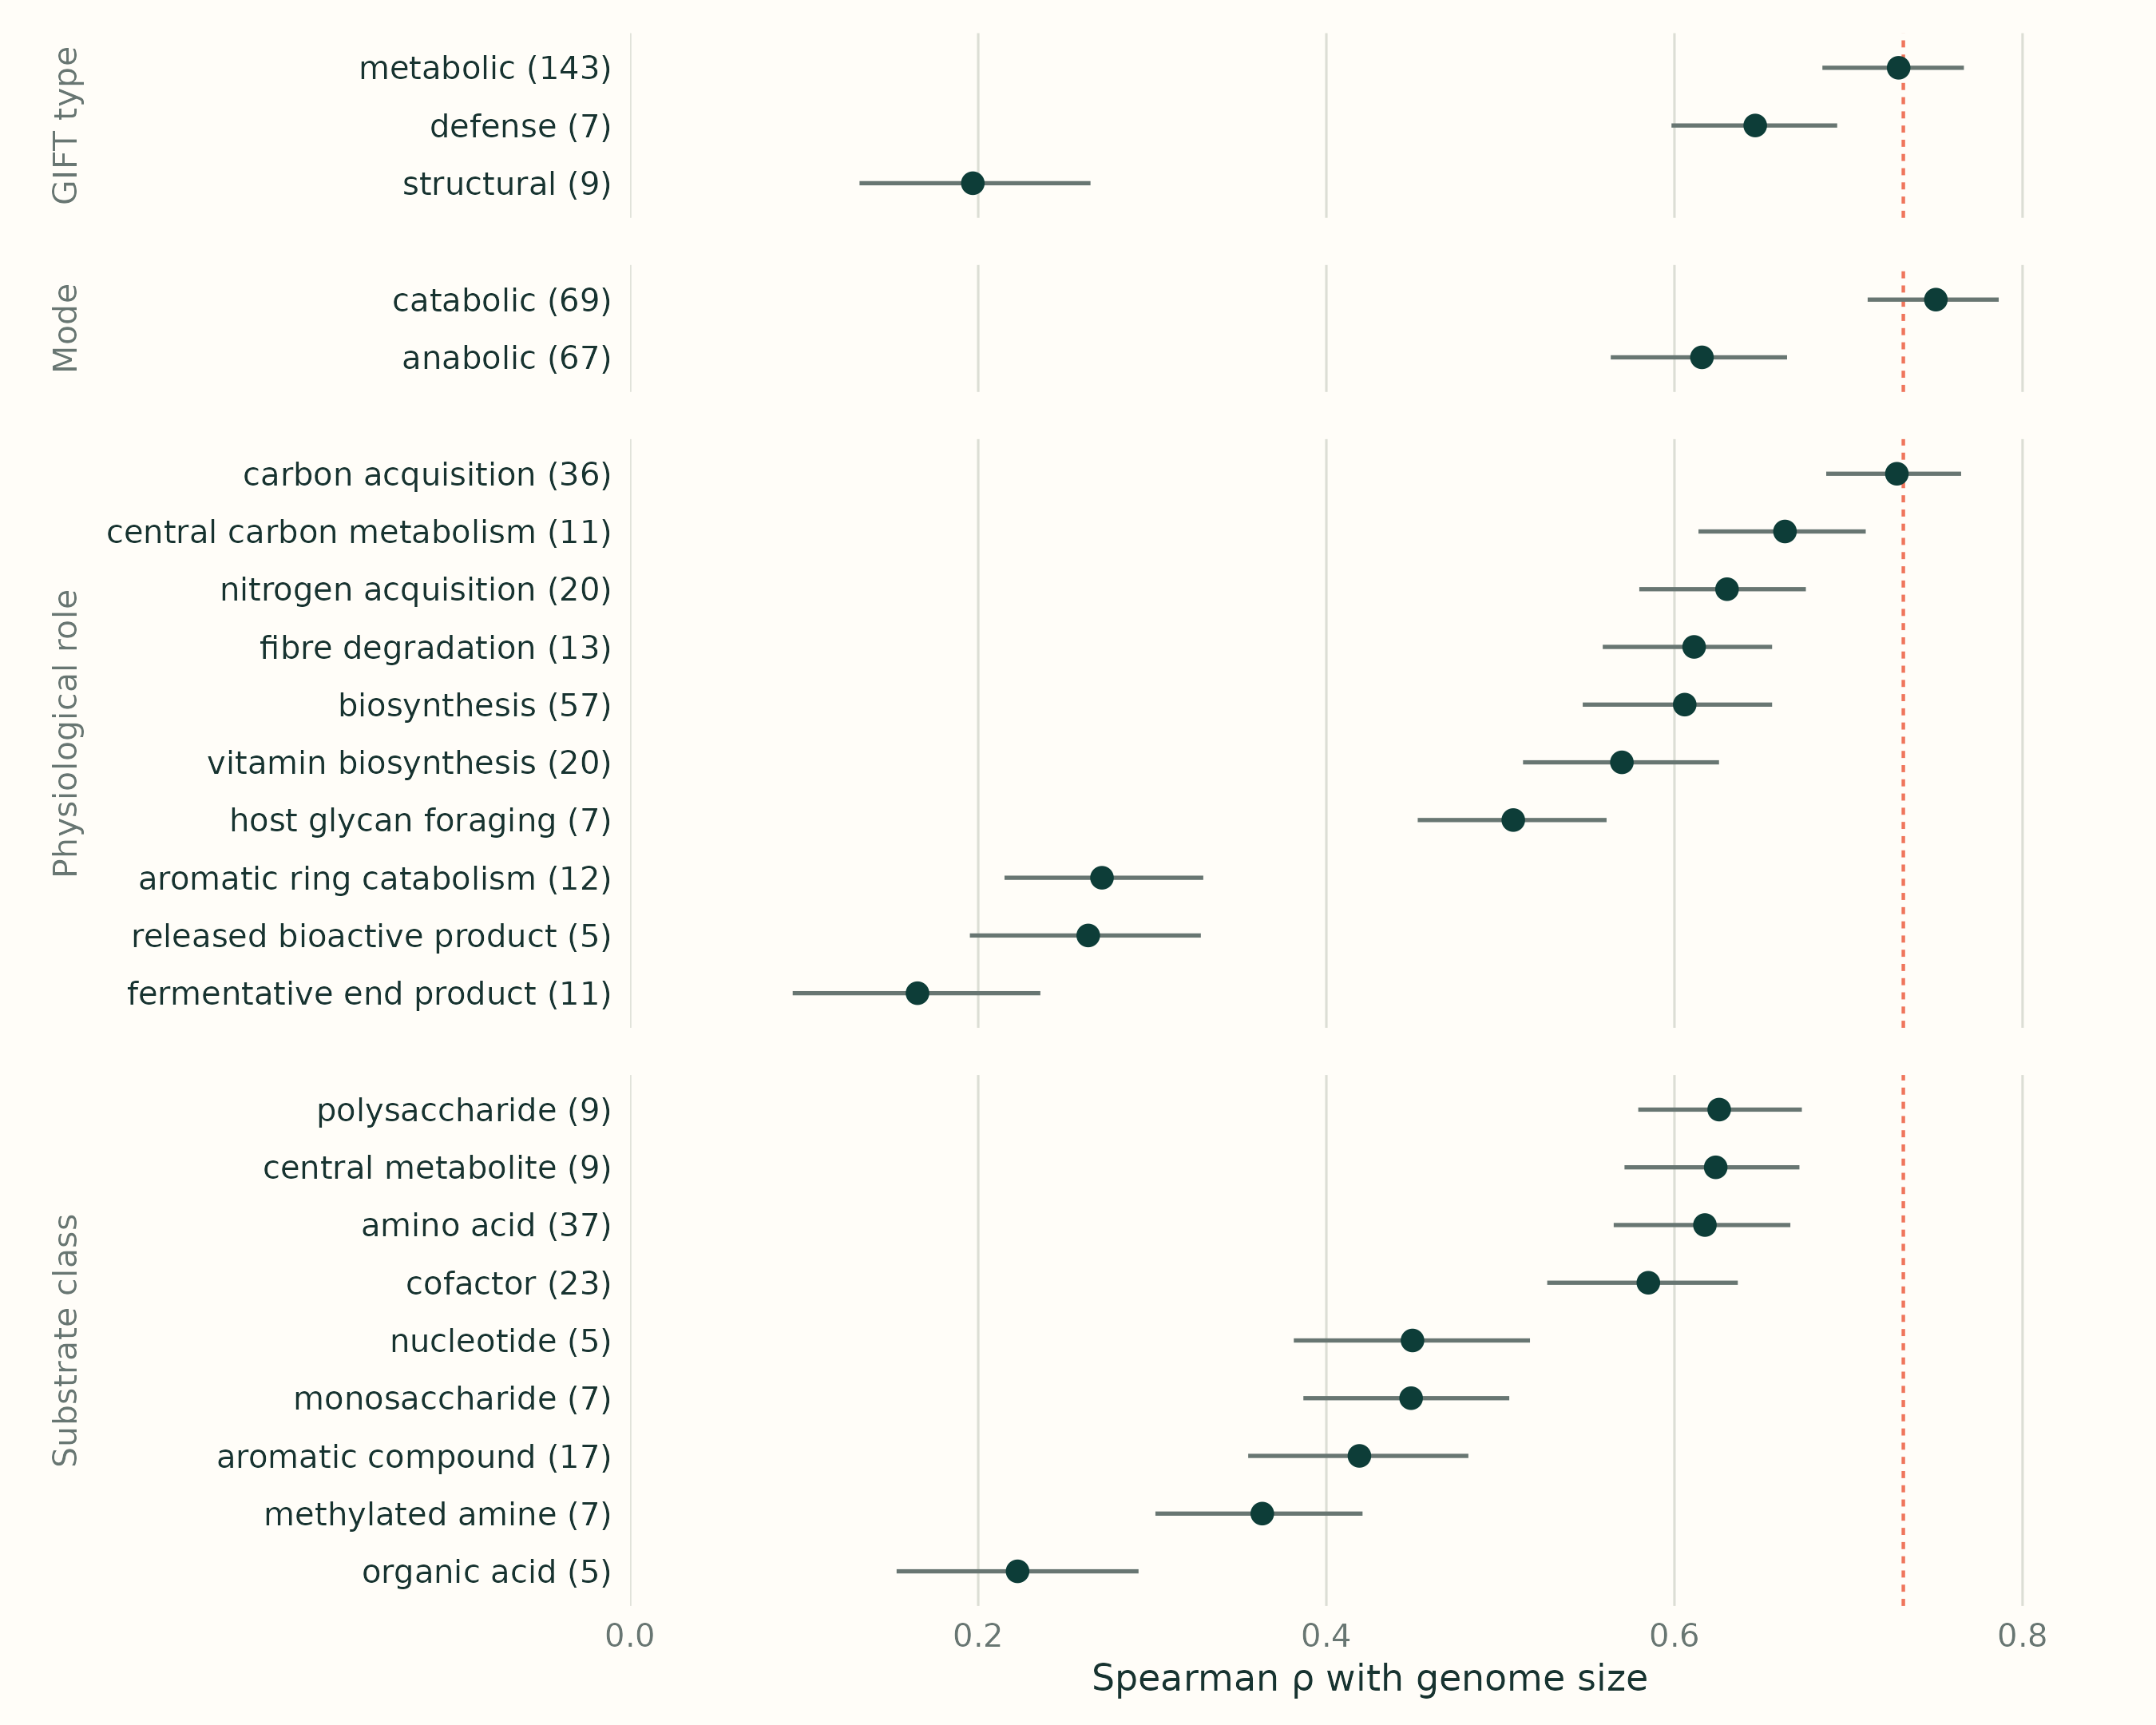
Correlation between genome size and the number of supported GIFTs in each class with at least five GIFTs (count in brackets), with 95% bootstrap intervals. Classes come from the GIFT type, the metabolic mode and two curated facets, and a GIFT can belong to several.
The dashed line is the correlation for the whole catalogue, and mode is the metabolic mode of a GIFT. Catabolic GIFTs follow genome size more closely (ρ = 0.75) than anabolic ones (ρ = 0.62): the classes that follow size most closely are those for acquiring carbon and nitrogen, while biosynthetic classes are already widely supported in mid-sized genomes. Two kinds of capability barely follow size at all, structural machinery (ρ = 0.20) and fermentative end products (ρ = 0.17), which are properties of a lineage’s way of life and not of how much it encodes.
How capabilities are distributed over the tree
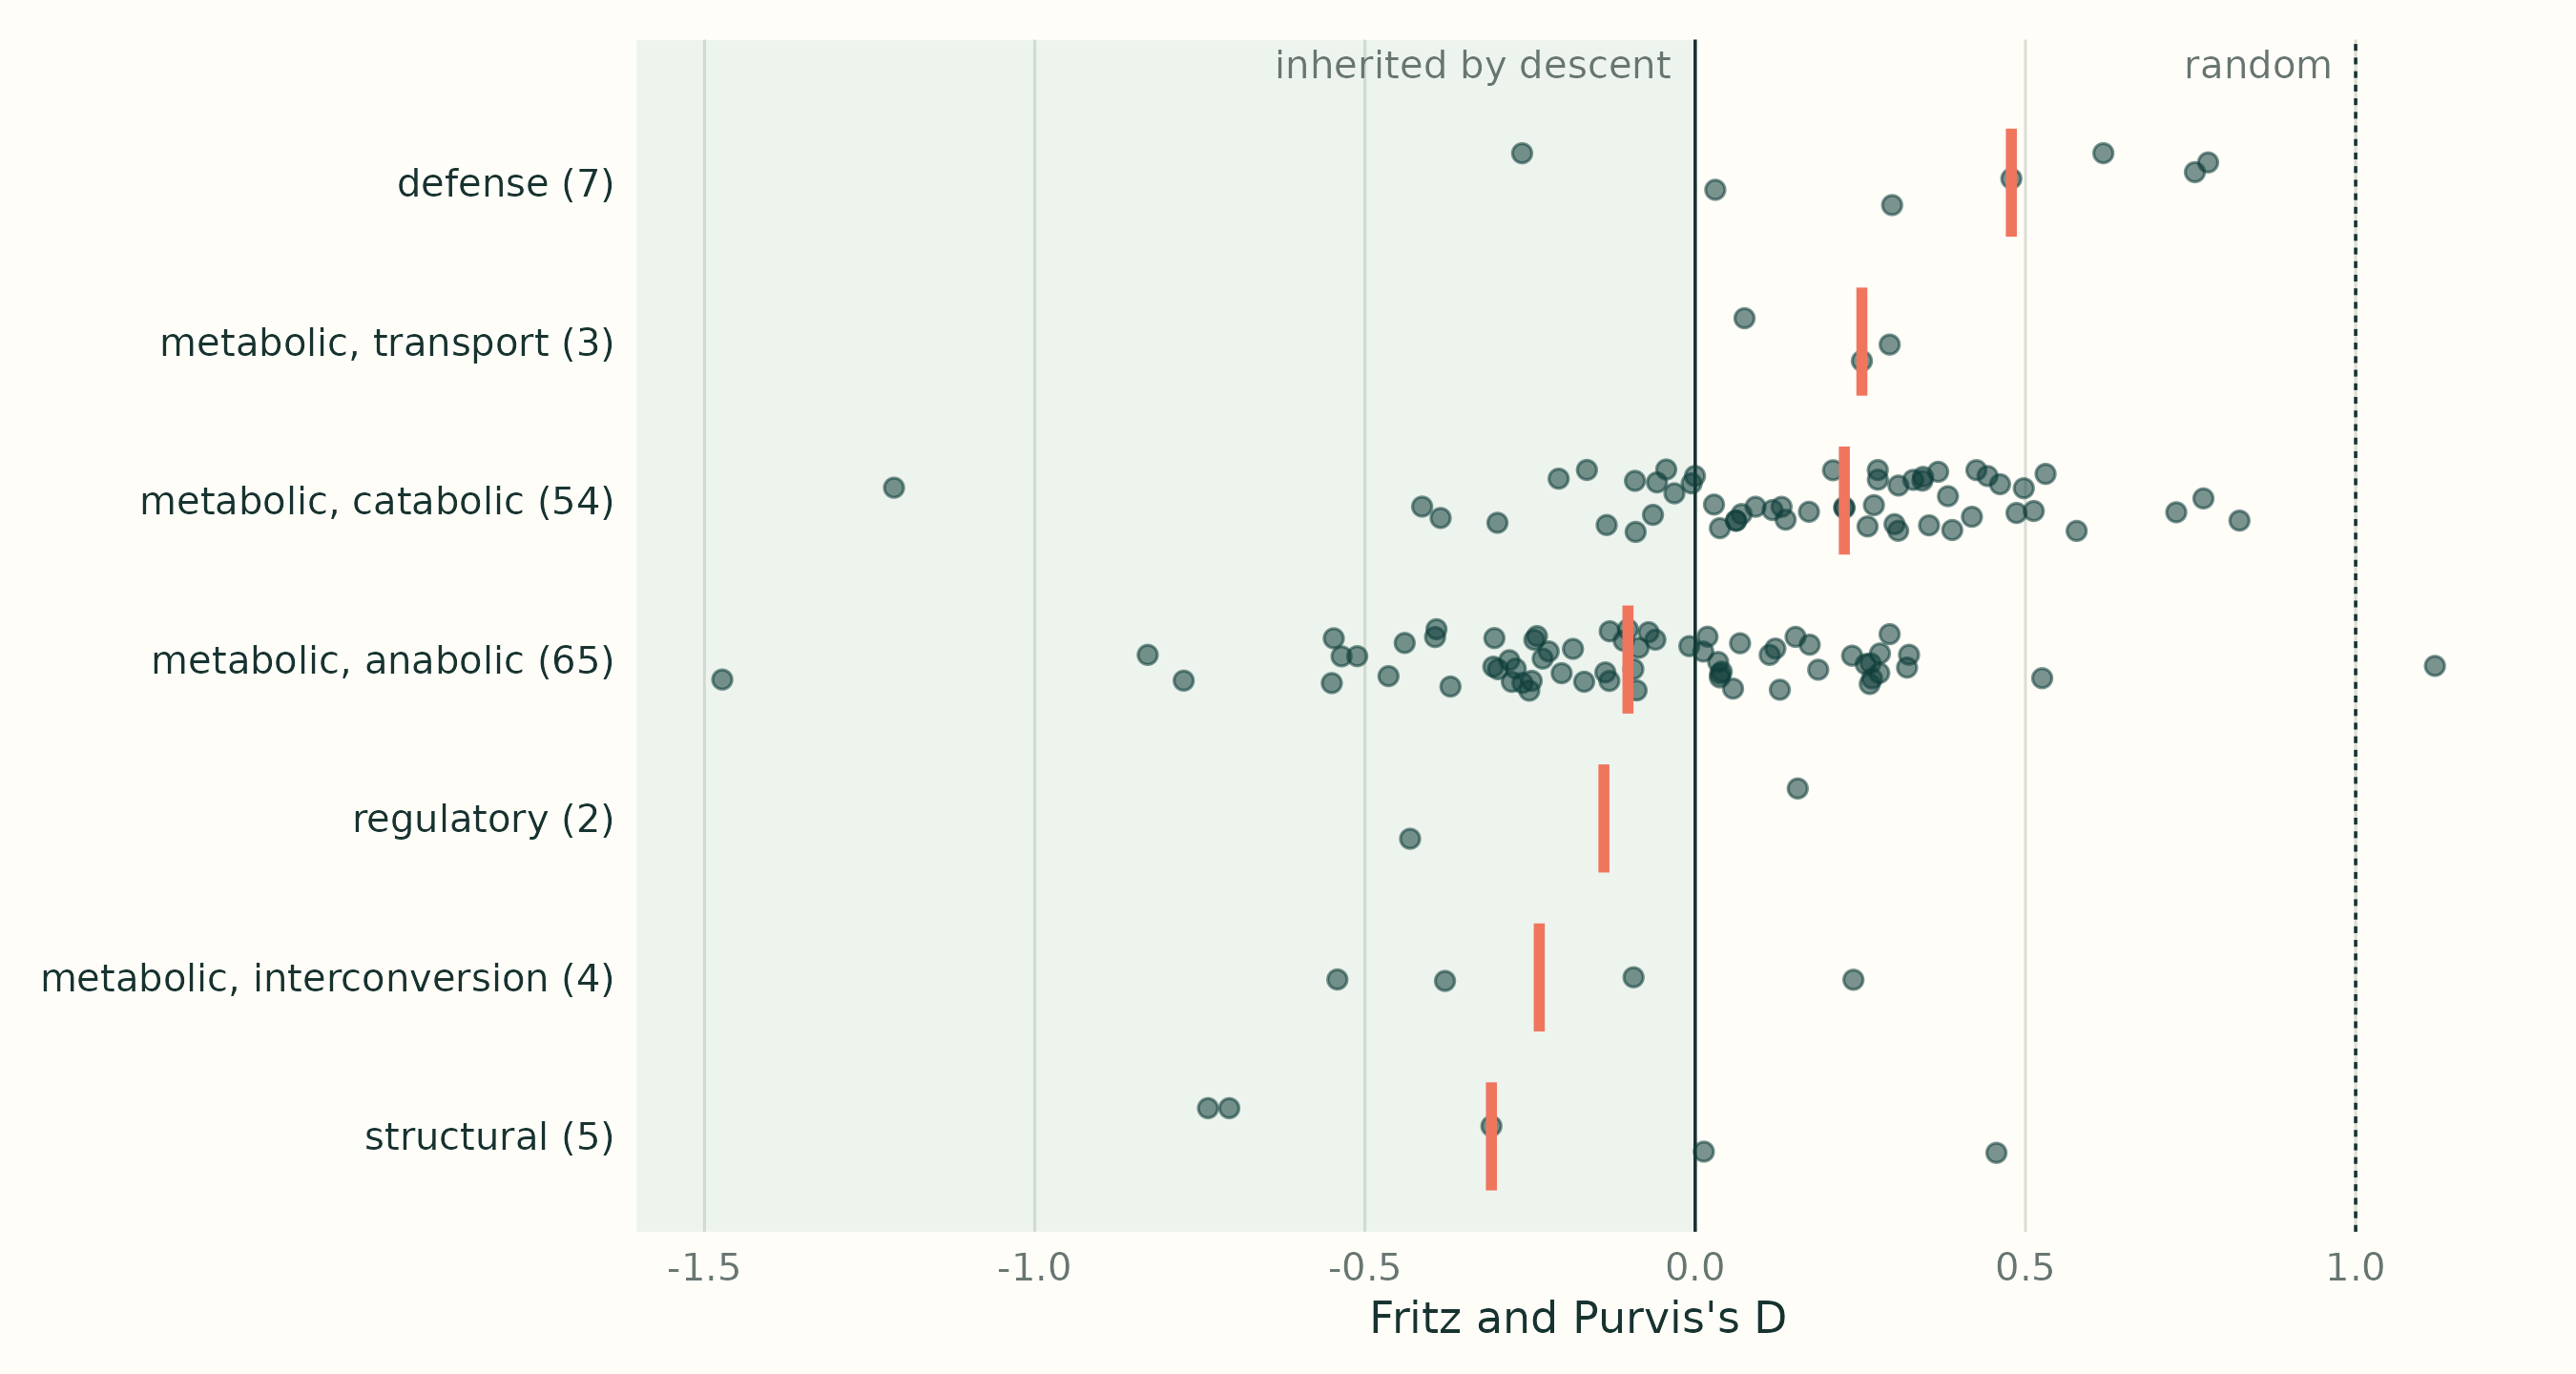
Phylogenetic signal of each GIFT that at least ten genomes support and at least ten lack, as Fritz and Purvis’s D. A GIFT near 0 is as clumped on the tree as a trait inherited by descent; a GIFT near 1 is scattered at random. Bars are class medians.
Most GIFTs are conserved: 131 of the 140 tested are as clumped on the tree as descent with modification predicts. The classes differ in the direction the previous section suggests. Anabolic GIFTs are the most conserved of the large classes (median D = -0.10), catabolic GIFTs are more scattered (0.23), and defense GIFTs are the most scattered of all (0.48), as expected of systems that move between lineages.
Origin adds little beyond lineage
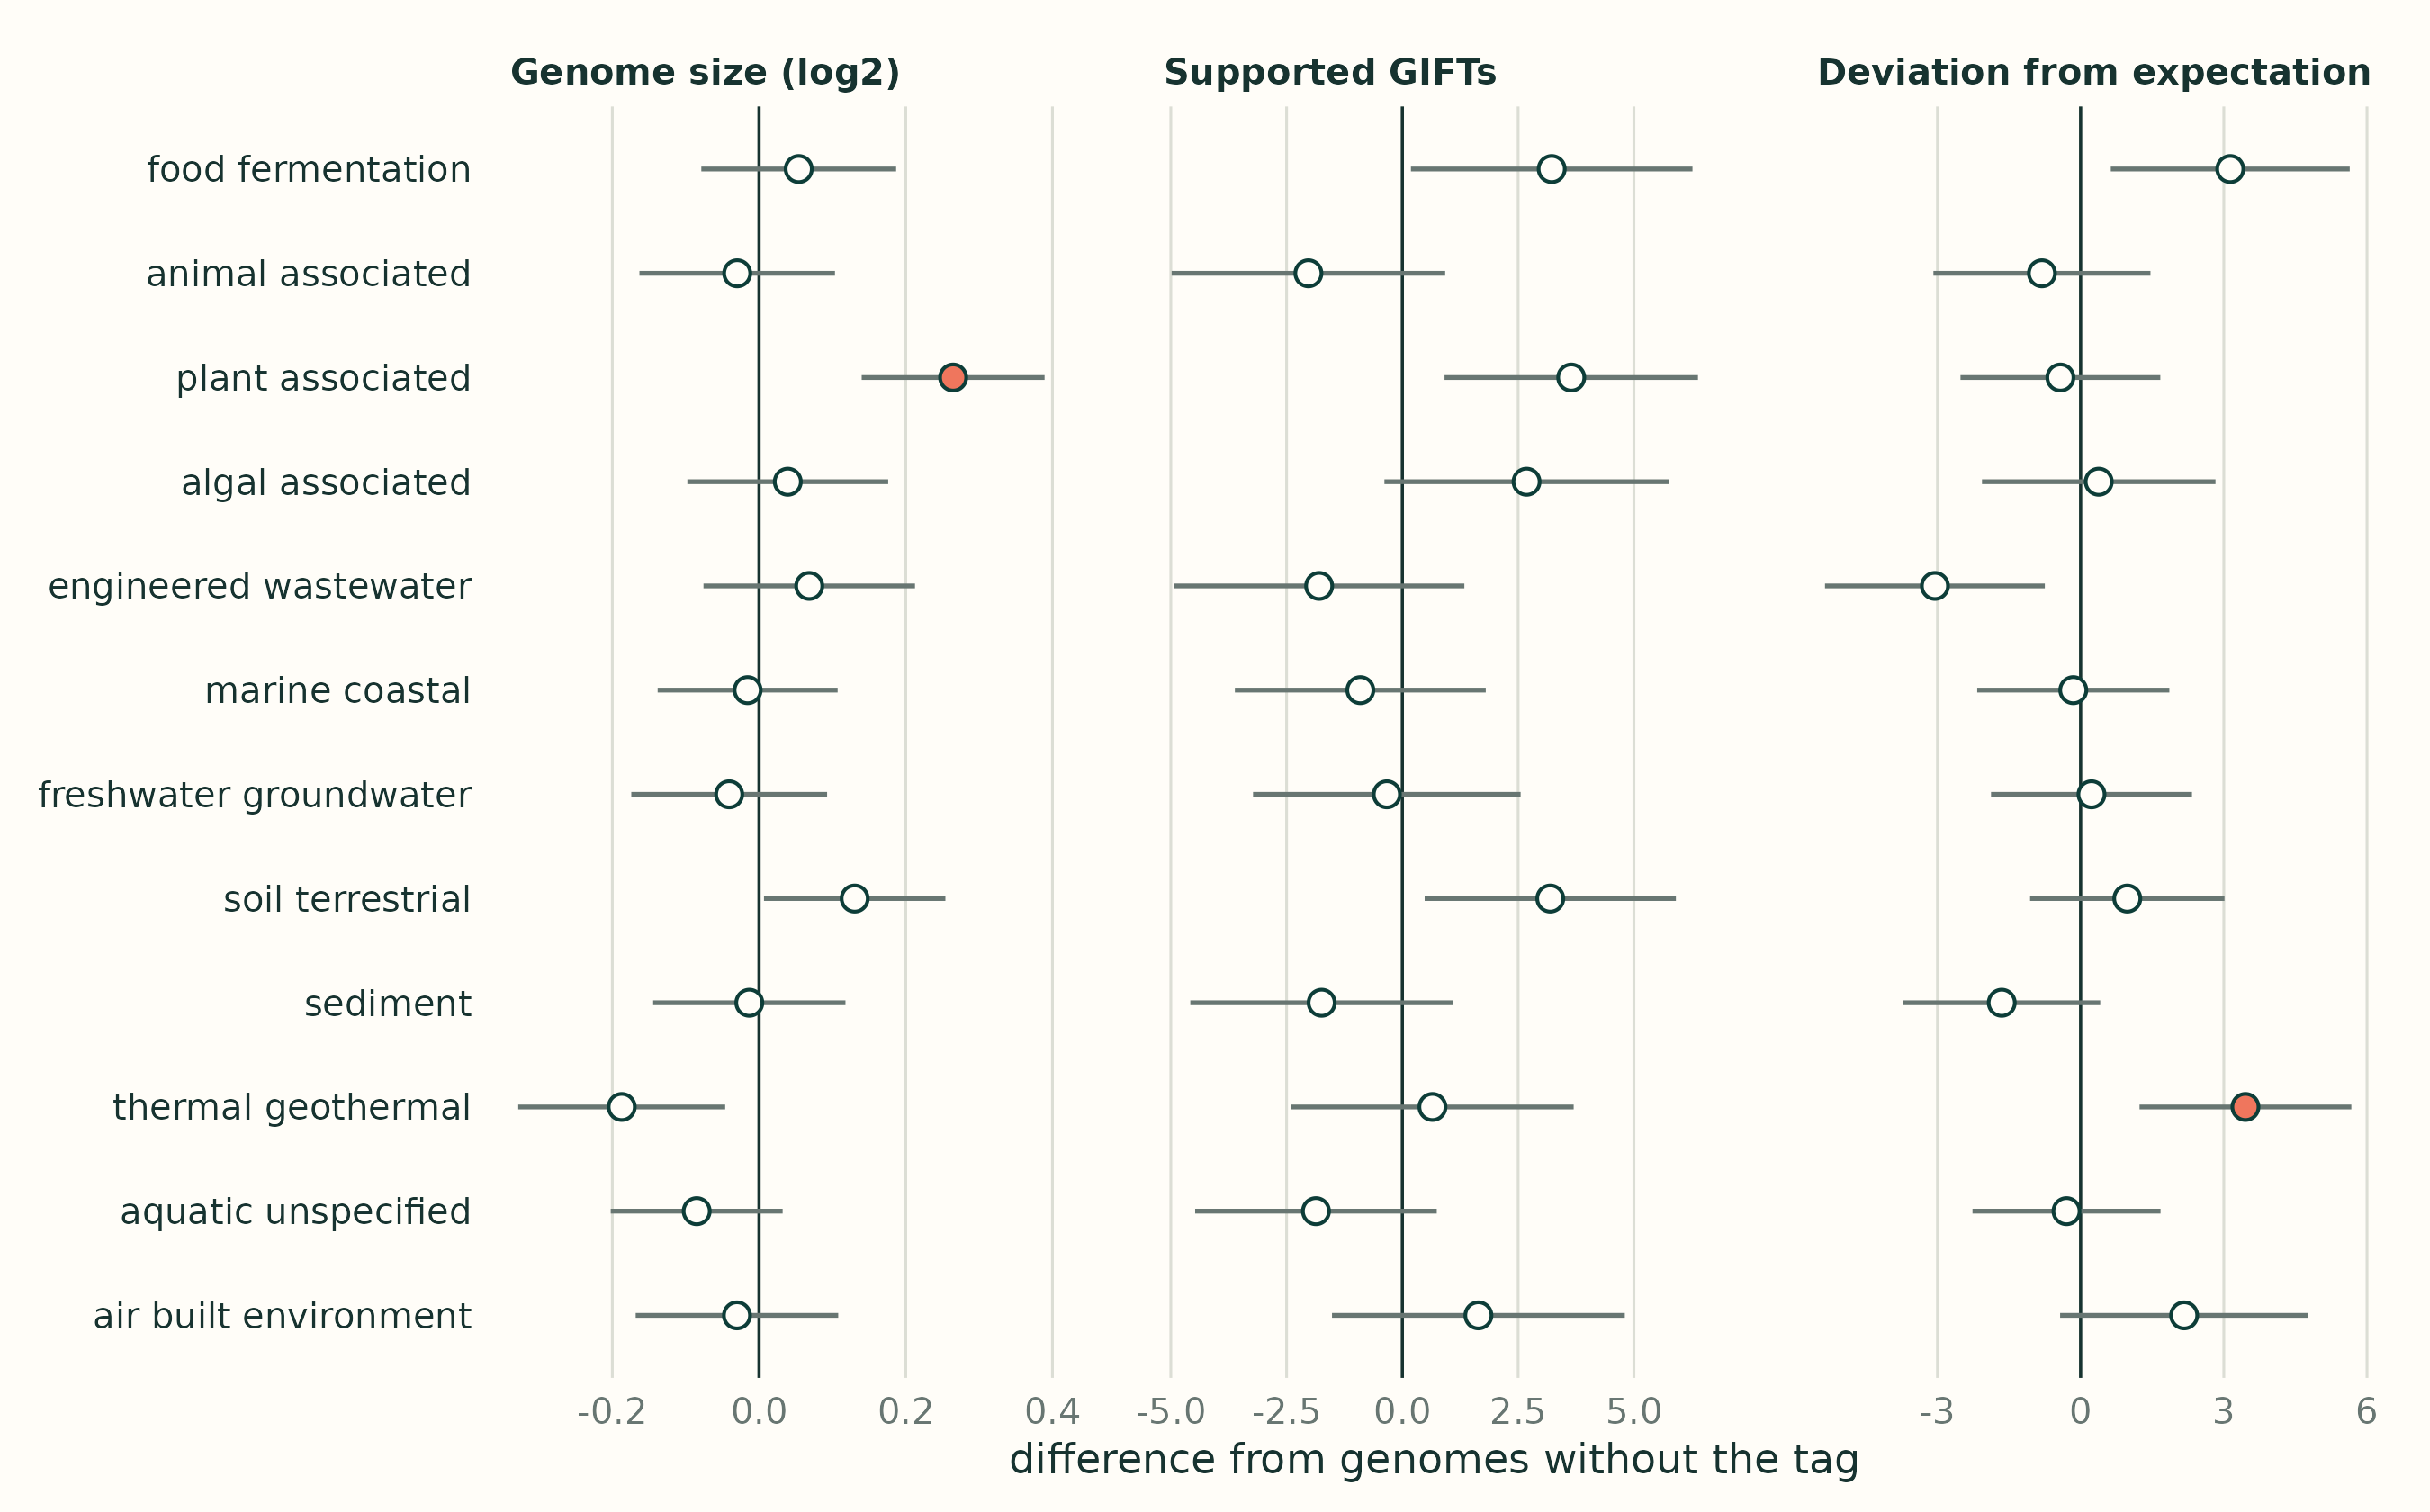
Difference associated with each origin group, from phylogenetic regressions in which the twelve groups with at least twenty genomes are fitted together. Points with 95% intervals; filled points pass a false discovery rate of 0.05.
Before accounting for phylogeny, origin groups look very different: plant-associated genomes support 13 more GIFTs than the rest and animal-associated genomes 10 fewer. Most of that is which lineages live where. In the phylogenetic regressions two differences remain: plant-associated genomes are larger (20%), and genomes from thermal environments support 3.5 more GIFTs than their size predicts.
One step short
A near miss is an unsupported GIFT whose closest implementation lacks exactly one of at least two requirements. gifter never counts a near miss as support, but it reports each one with the requirement that is missing, and across a broad panel those reports add up to a map of where the catalogue, the markers or the biology fall short.
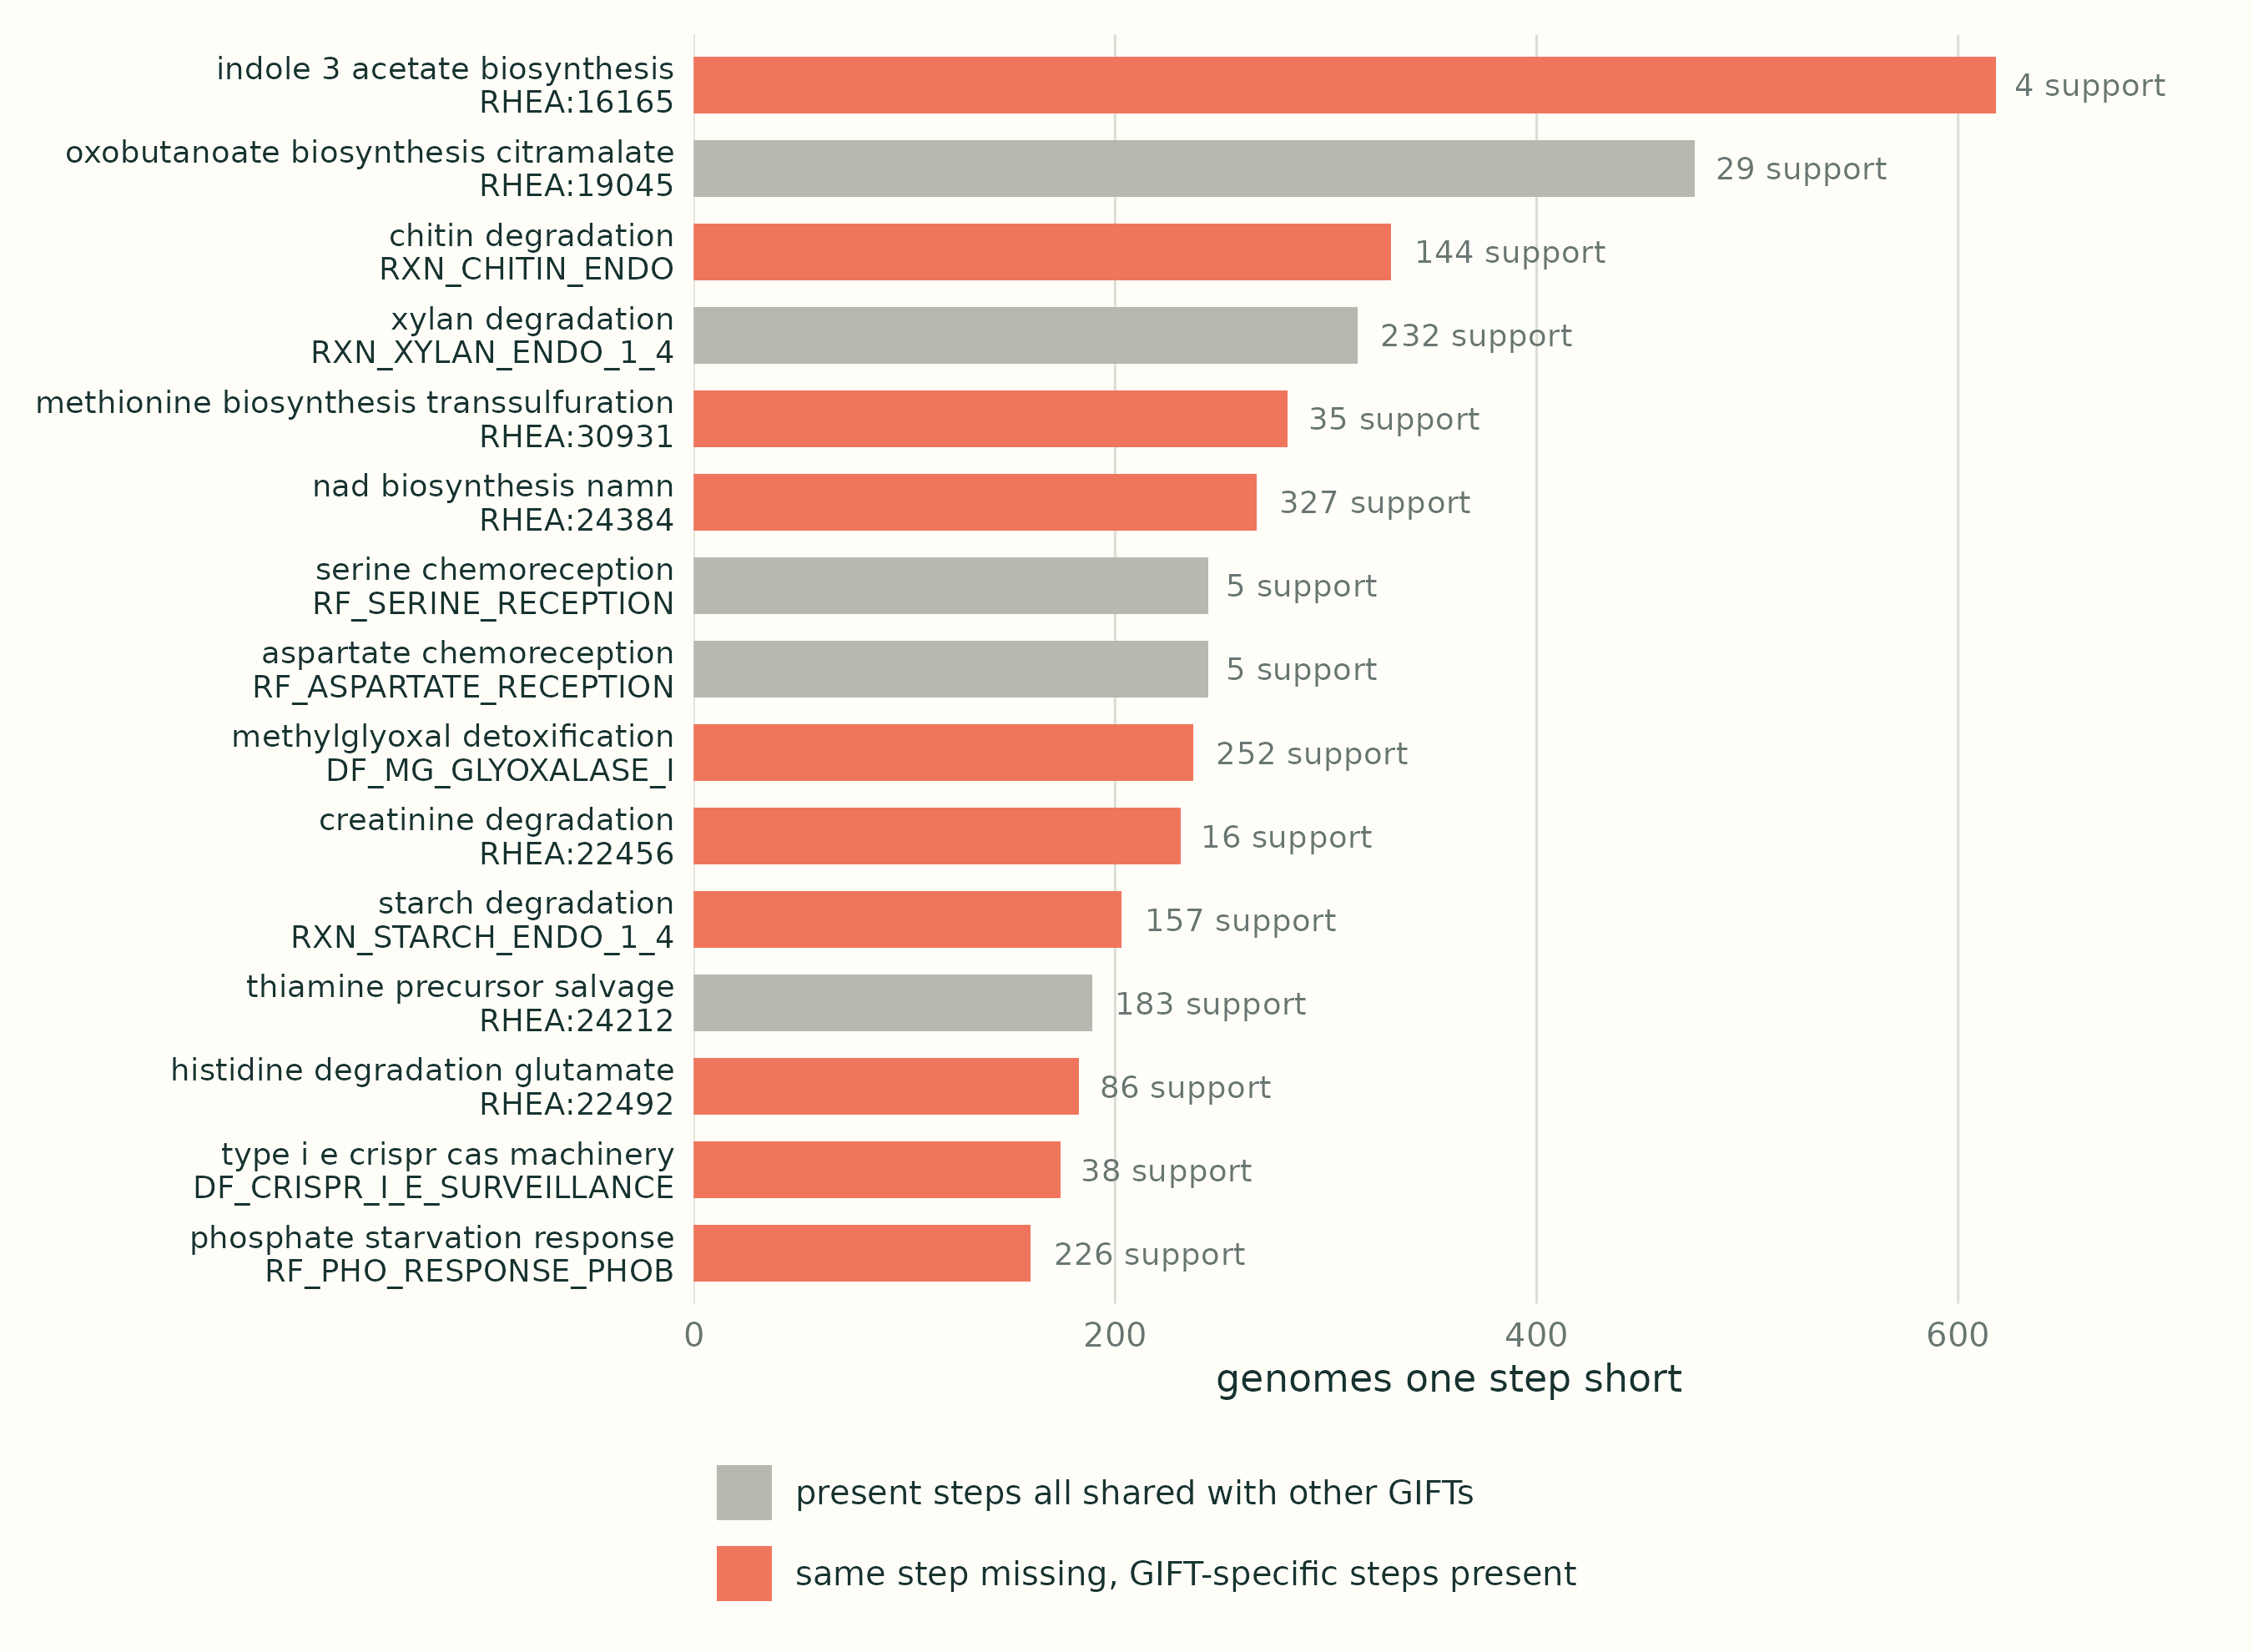
The fifteen requirements most often missing alone. Each bar is one implementation of a GIFT and the single requirement its near misses lack; the number of genomes that support the GIFT is given at the end of the bar.
The median genome is one step short of 18 GIFTs. The near misses fall into three readings:
| Reading | Share of near misses | What it suggests |
|---|---|---|
| The same step is missing, and steps specific to the GIFT are present | 47% | An alternative enzyme or marker we have not curated yet, or a step the lineage does not encode |
| The missing step varies, and steps specific to the GIFT are present | 29% | Scattered gaps, with no single candidate |
| Every step present is shared with other GIFTs | 23% | No evidence for this GIFT in particular; the shared steps belong to something else |
The first reading is the one we can act on. The most frequent case is indole 3 acetate biosynthesis: 618 genomes carry one of its two requirements and lack RHEA:16165, while only 4 support the GIFT. A gap that consistent is a point we will analyse to improve the definition of the GIFT.
We have logged these gaps as open leads, and none has been assessed yet. Each one will go through the full curation process, which may add an alternative route or marker, or confirm that the lineage does not encode the step. The panel is then evaluated again with the new database release, so the numbers on this page belong to database 2026.37.1 and will move as the definitions improve. The loop is described in Refine the catalogue iteratively.
Reproduce this analysis
The panel, the calls and every table behind this page are committed
to the repository under manuscript/analysis/.
| Script | What it does |
|---|---|
23-gtdb-phylogeny.R |
Selects and locks the panel, evaluates the calls |
26-gtdb-repertoire-genome-size.R |
Size expectation and deviations by taxon |
27-gtdb-size-signal-and-gift-classes.R |
Phylogenetic signal of the deviation; classes of GIFT against size |
28-gtdb-origin-and-annotations.R |
Origin groups and assembly annotations |
29-gtdb-near-misses-and-gift-signal.R |
Near misses; phylogenetic signal of each GIFT |
30-gtdb-near-miss-steps.R |
Which requirement is missing in a near miss |
The panel itself, with accessions, taxonomy, origin tags and the
pruned tree, is in gtdb-phylogeny/.