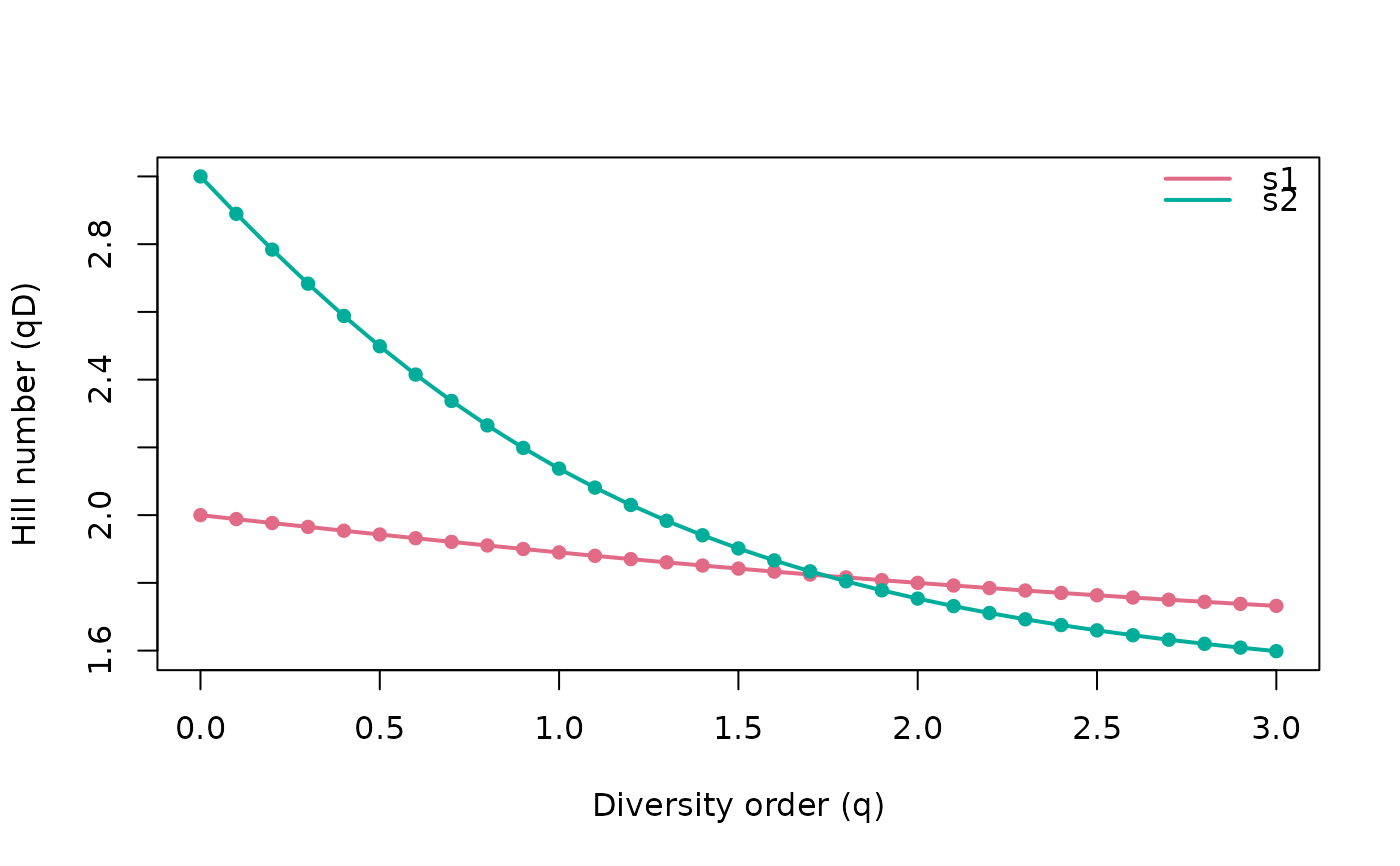
Compute a diversity profile: Hill numbers evaluated over a fine sweep of
diversity orders q. Profiles are the standard diagnostic for comparing the
diversity of assemblages, since the ranking of samples can change with q.
Arguments
- data
Counts: a numeric vector (one sample), a matrix/data.frame (taxa x samples), a
phyloseqobject or aTreeSummarizedExperiment.- q
Numeric vector of diversity orders to evaluate. Defaults to a fine sweep from 0 to 3.
- tree
A phylogenetic tree of class
phylowhose tip labels match the taxa indata.- dist
A functional distance matrix (or
dist) over the taxa.- tau
Optional functional distance threshold. Defaults to
max(dist).- type
Diversity type:
"auto"(default) infers it from the inputs (counts only -> neutral,+tree-> phylogenetic,+dist-> functional); an explicit"neutral","phylogenetic"or"functional"asserts the type and is validated against the inputs (e.g."phylogenetic"requires atree;"neutral"ignores any tree/dist carried by the object).- reference
Reference tree depth for phylogenetic Hill numbers (ignored for neutral and functional types).
"pool"(default) reads every sample at one common depthT = mean(T_j), so values share a comparable axis across samples;"sample"reads each sample at its own depthT_j(effective lineages at that sample's depth). The two coincide on ultrametric trees. This reference depth is intentionally not offered byhillpart(): in a partitionTis fixed at the mean per-sample depth of Chiu et al. (2014), the unique value for whichgamma / alphais a valid decomposition withbetain[1, N].- out
Output type:
"tibble"(default, long format ready for plotting) or"matrix".
Value
A long-format data.frame of class hill_profile (columns q,
sample, value) with a plot() method, or a matrix
(samples in rows, orders in columns) when out = "matrix".