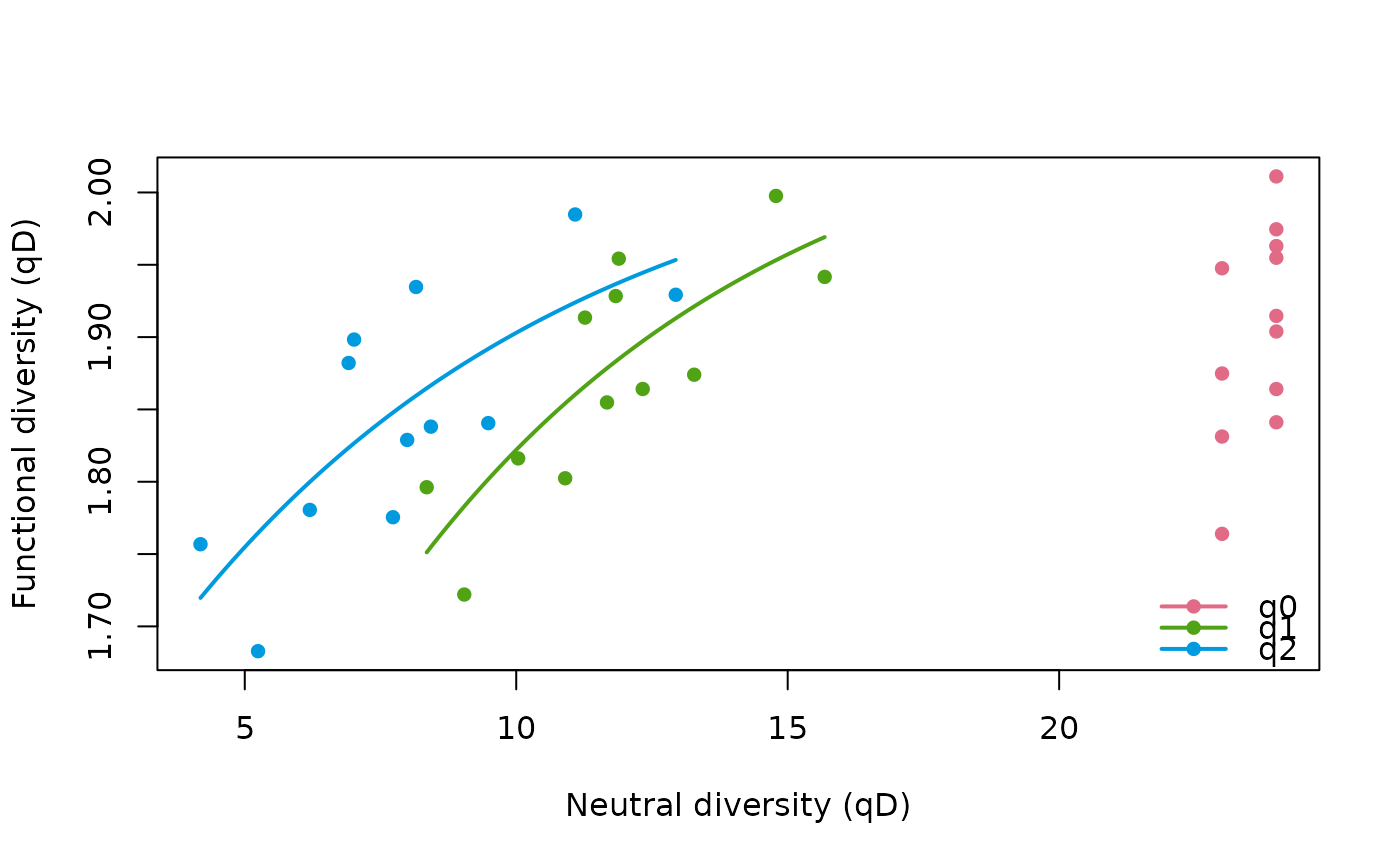
Estimate phylogenetic or functional redundancy by fitting the saturating
relationship between neutral diversity and phylogenetic/functional diversity
across samples: y = -a * 2^(-x / b) + c. Redundancy is summarised as
1 - b / max(x).
Arguments
- data
A count table (taxa x samples); requires either
treeordist.- q
Numeric vector of diversity orders (>= 0). Defaults to
c(0, 1, 2)(richness, Shannon, Simpson).- tree
A phylogenetic tree of class
phylowhose tip labels match the taxa indata.- dist
A functional distance matrix (or
dist) over the taxa.- tau
Optional functional distance threshold. Defaults to
max(dist).- type
Diversity type:
"auto"(default) infers it from the inputs (counts only -> neutral,+tree-> phylogenetic,+dist-> functional); an explicit"neutral","phylogenetic"or"functional"asserts the type and is validated against the inputs (e.g."phylogenetic"requires atree;"neutral"ignores any tree/dist carried by the object).- reference
Reference tree depth for phylogenetic Hill numbers (ignored for neutral and functional types).
"pool"(default) reads every sample at one common depthT = mean(T_j), so values share a comparable axis across samples;"sample"reads each sample at its own depthT_j(effective lineages at that sample's depth). The two coincide on ultrametric trees. This reference depth is intentionally not offered byhillpart(): in a partitionTis fixed at the mean per-sample depth of Chiu et al. (2014), the unique value for whichgamma / alphais a valid decomposition withbetain[1, N].- out
Output shape:
"tibble"(default) returns adata.framewith one row perqand columnsq,redundancy,a,b,c;"matrix"returns the legacy matrix (orders in rows).
Value
A data.frame of class hill_redundancy (default) with a
plot() method, or a matrix with columns
redundancy, a, b, c (one row per q) when out = "matrix". The
tibble carries the per-sample neutral and phylogenetic/functional diversity
used for the fit as a "hill_fit" attribute, which the plot method draws.
Examples
d <- traits2dist(gut_traits)
red <- hillred(gut_counts, dist = d)
#> Warning: Redundancy for "q0" could not be estimated: singular gradient matrix at initial
#> parameter estimates
red
#> <hilldiv3 result: functional>
#> 3 rows x 5 cols
#>
#>   q redundancy         a        b        c
#> 1 0         NA        NA       NA       NA
#> 2 1  0.6957598 1.1191127 4.770948 2.083805
#> 3 2  0.6024724 0.5929265 5.143368 2.057040
plot(red)